'/%3e%3cpath%20d='M110.5%2074.84L61.56%20113.3V150.04H0V87.4L110.5%200V74.84Z'%20fill='url(%23paint1_linear_1102_1766)'/%3e%3cpath%20d='M159.44%20150.04L159.44%20205.81H159.2L110.5%20166.53L61.8001%20205.81H61.5601L61.56%20150.04L110.5%20110.57L159.44%20150.04Z'%20fill='url(%23paint2_linear_1102_1766)'/%3e%3cpath%20d='M110.5%20110.57V166.53L61.8001%20205.81H61.5601L61.56%20150.04L110.5%20110.57Z'%20fill='url(%23paint3_linear_1102_1766)'/%3e%3cpath%20d='M159.44%20206H61.5601L61.8001%20205.81L110.5%20166.53L159.2%20205.81L159.44%20206Z'%20fill='url(%23paint4_linear_1102_1766)'/%3e%3cdefs%3e%3clinearGradient%20id='paint0_linear_1102_1766'%20x1='166'%20y1='-19.908'%20x2='145.641'%20y2='227.731'%20gradientUnits='userSpaceOnUse'%3e%3cstop%20stop-color='%23B5AAFF'/%3e%3cstop%20offset='0.723958'%20stop-color='%238977FF'/%3e%3c/linearGradient%3e%3clinearGradient%20id='paint1_linear_1102_1766'%20x1='64'%20y1='15.7891'%20x2='172.309'%20y2='257.652'%20gradientUnits='userSpaceOnUse'%3e%3cstop%20stop-color='%239383FF'/%3e%3cstop%20offset='0.75'%20stop-color='%234D3FED'/%3e%3c/linearGradient%3e%3clinearGradient%20id='paint2_linear_1102_1766'%20x1='171.462'%20y1='36.6188'%20x2='8.598'%20y2='270.272'%20gradientUnits='userSpaceOnUse'%3e%3cstop%20offset='0.229167'%20stop-color='%23B5AAFF'/%3e%3cstop%20offset='0.994792'%20stop-color='%238977FF'/%3e%3c/linearGradient%3e%3clinearGradient%20id='paint3_linear_1102_1766'%20x1='55.7219'%20y1='-31.3876'%20x2='76.8187'%20y2='349.172'%20gradientUnits='userSpaceOnUse'%3e%3cstop%20offset='0.307292'%20stop-color='%239383FF'/%3e%3cstop%20offset='0.854167'%20stop-color='%234D3FED'/%3e%3c/linearGradient%3e%3clinearGradient%20id='paint4_linear_1102_1766'%20x1='110'%20y1='271'%20x2='76.5255'%20y2='202.314'%20gradientUnits='userSpaceOnUse'%3e%3cstop%20stop-color='%23B5AAFF'/%3e%3cstop%20offset='0.90625'%20stop-color='%238977FF'/%3e%3c/linearGradient%3e%3c/defs%3e%3c/svg%3e)
'/%3e%3cpath%20d='M110.5%2074.84L61.56%20113.3V150.04H0V87.4L110.5%200V74.84Z'%20fill='url(%23paint1_linear_1102_1752)'/%3e%3cpath%20d='M159.44%20150.04L159.44%20205.81H159.2L110.5%20166.53L61.8001%20205.81H61.5601L61.56%20150.04L110.5%20110.57L159.44%20150.04Z'%20fill='url(%23paint2_linear_1102_1752)'/%3e%3cpath%20d='M110.5%20110.57V166.53L61.8001%20205.81H61.5601L61.56%20150.04L110.5%20110.57Z'%20fill='url(%23paint3_linear_1102_1752)'/%3e%3cpath%20d='M159.44%20206H61.5601L61.8001%20205.81L110.5%20166.53L159.2%20205.81L159.44%20206Z'%20fill='url(%23paint4_linear_1102_1752)'/%3e%3cdefs%3e%3clinearGradient%20id='paint0_linear_1102_1752'%20x1='166'%20y1='-19.908'%20x2='145.641'%20y2='227.731'%20gradientUnits='userSpaceOnUse'%3e%3cstop%20stop-color='%23B5AAFF'/%3e%3cstop%20offset='0.723958'%20stop-color='%238977FF'/%3e%3c/linearGradient%3e%3clinearGradient%20id='paint1_linear_1102_1752'%20x1='64'%20y1='15.7891'%20x2='172.309'%20y2='257.652'%20gradientUnits='userSpaceOnUse'%3e%3cstop%20stop-color='%239383FF'/%3e%3cstop%20offset='0.75'%20stop-color='%234D3FED'/%3e%3c/linearGradient%3e%3clinearGradient%20id='paint2_linear_1102_1752'%20x1='171.462'%20y1='36.6188'%20x2='8.598'%20y2='270.272'%20gradientUnits='userSpaceOnUse'%3e%3cstop%20offset='0.229167'%20stop-color='%23B5AAFF'/%3e%3cstop%20offset='0.994792'%20stop-color='%238977FF'/%3e%3c/linearGradient%3e%3clinearGradient%20id='paint3_linear_1102_1752'%20x1='55.7219'%20y1='-31.3876'%20x2='76.8187'%20y2='349.172'%20gradientUnits='userSpaceOnUse'%3e%3cstop%20offset='0.307292'%20stop-color='%239383FF'/%3e%3cstop%20offset='0.854167'%20stop-color='%234D3FED'/%3e%3c/linearGradient%3e%3clinearGradient%20id='paint4_linear_1102_1752'%20x1='110'%20y1='271'%20x2='76.5255'%20y2='202.314'%20gradientUnits='userSpaceOnUse'%3e%3cstop%20stop-color='%23B5AAFF'/%3e%3cstop%20offset='0.90625'%20stop-color='%238977FF'/%3e%3c/linearGradient%3e%3c/defs%3e%3c/svg%3e)
Investment Properties in St Louis, MO
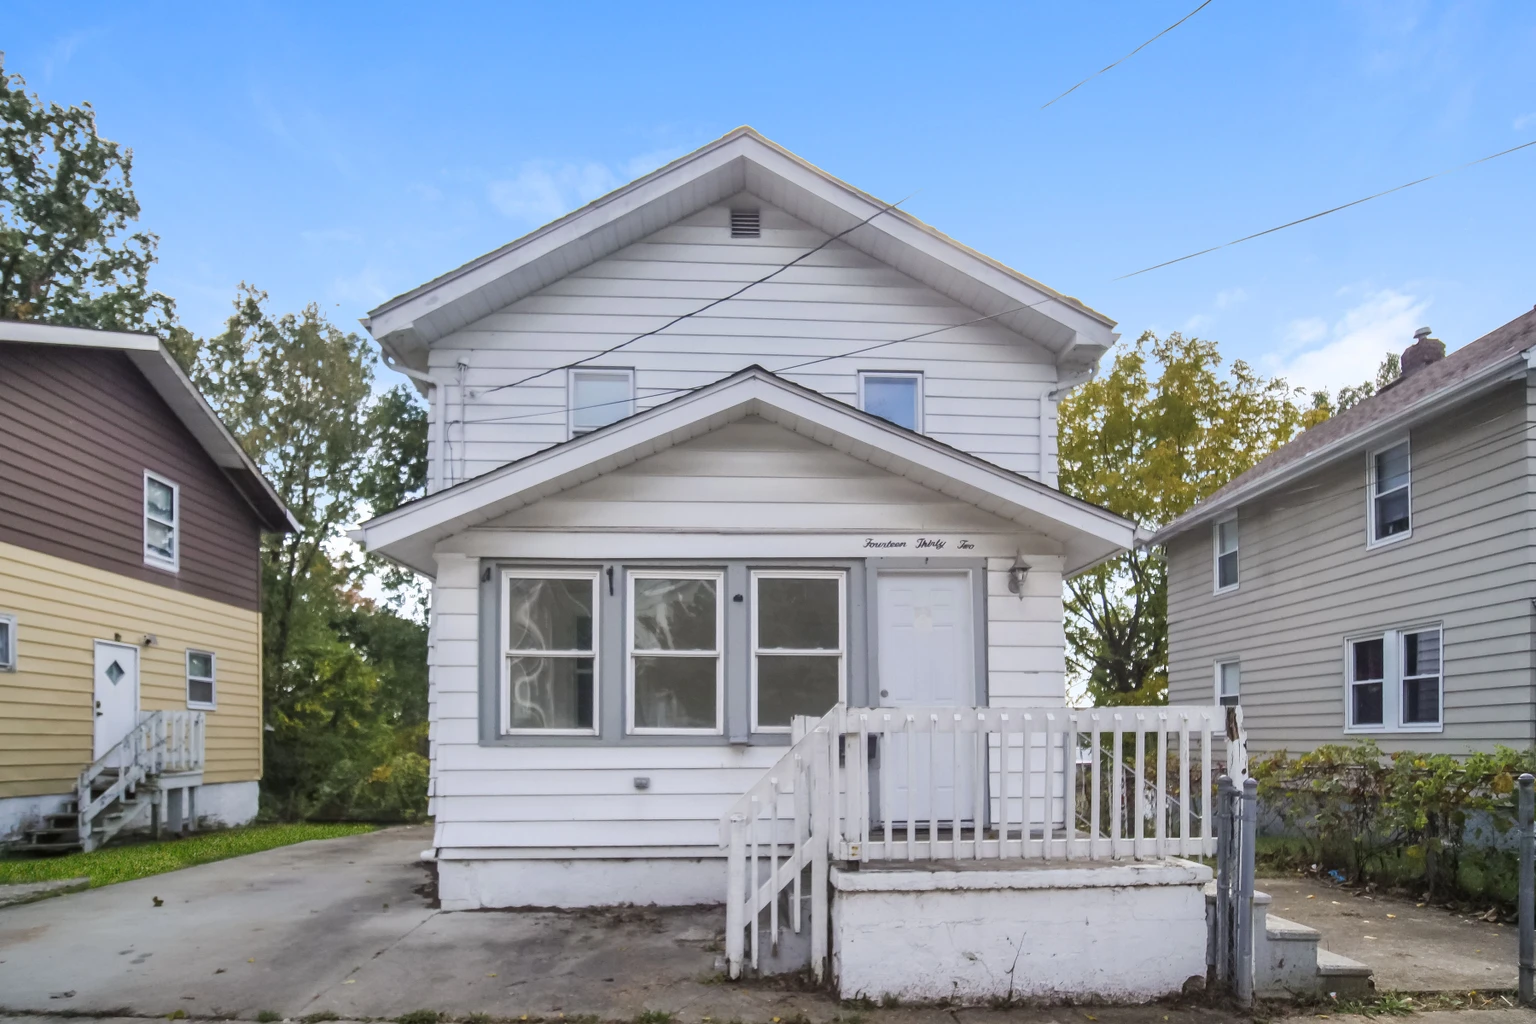
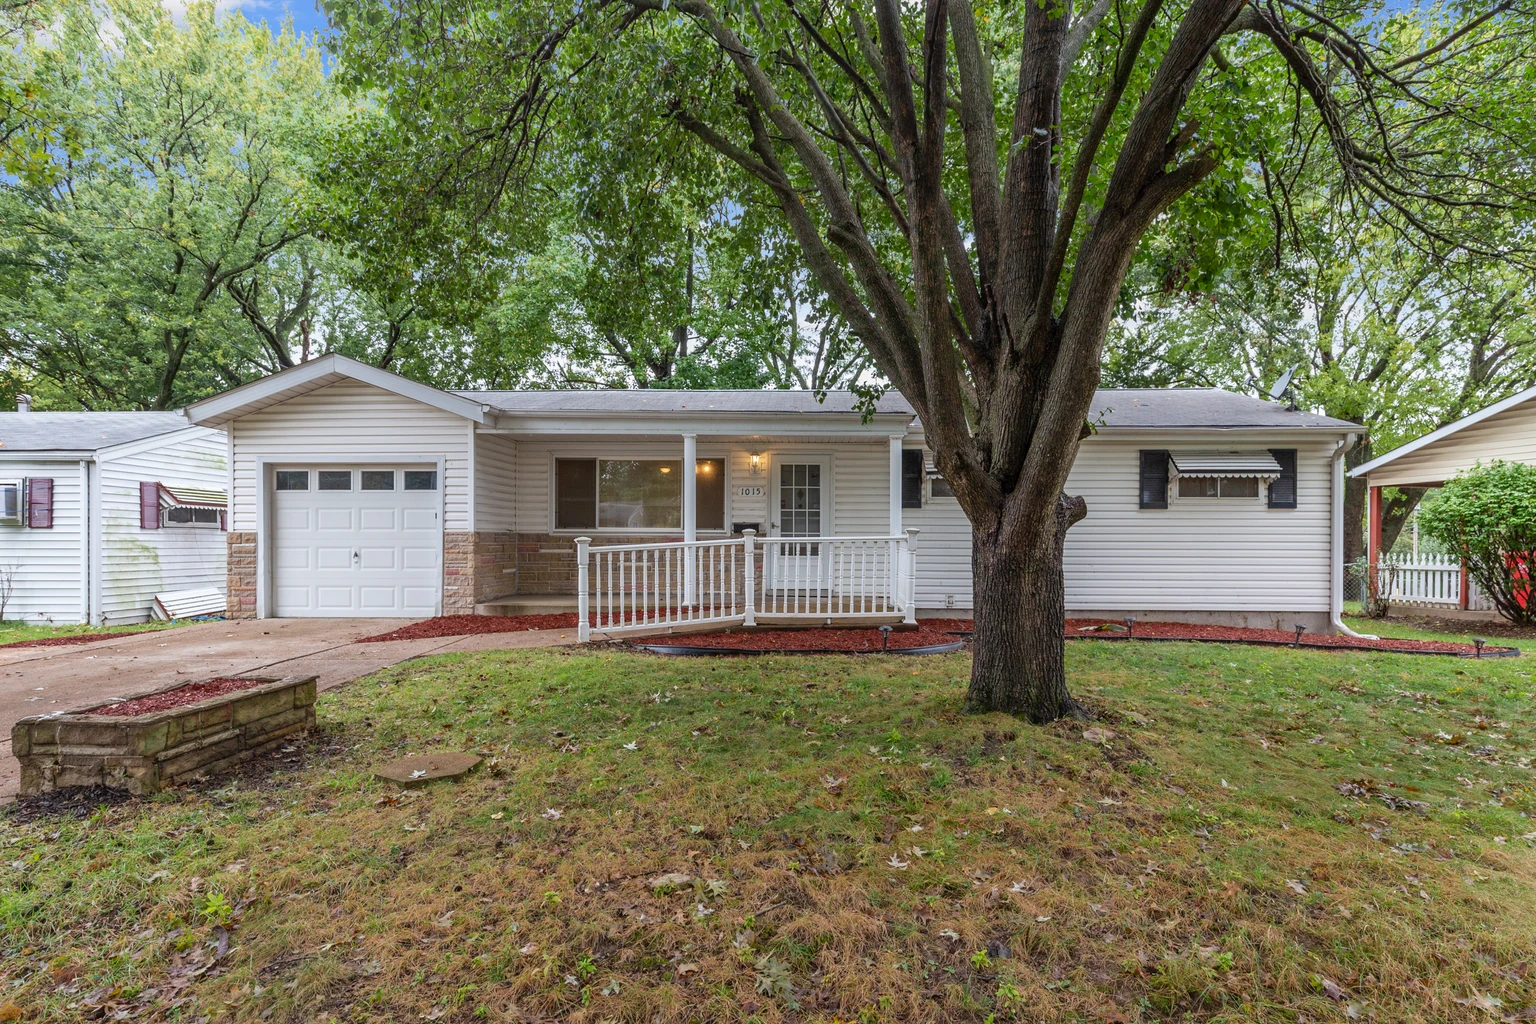
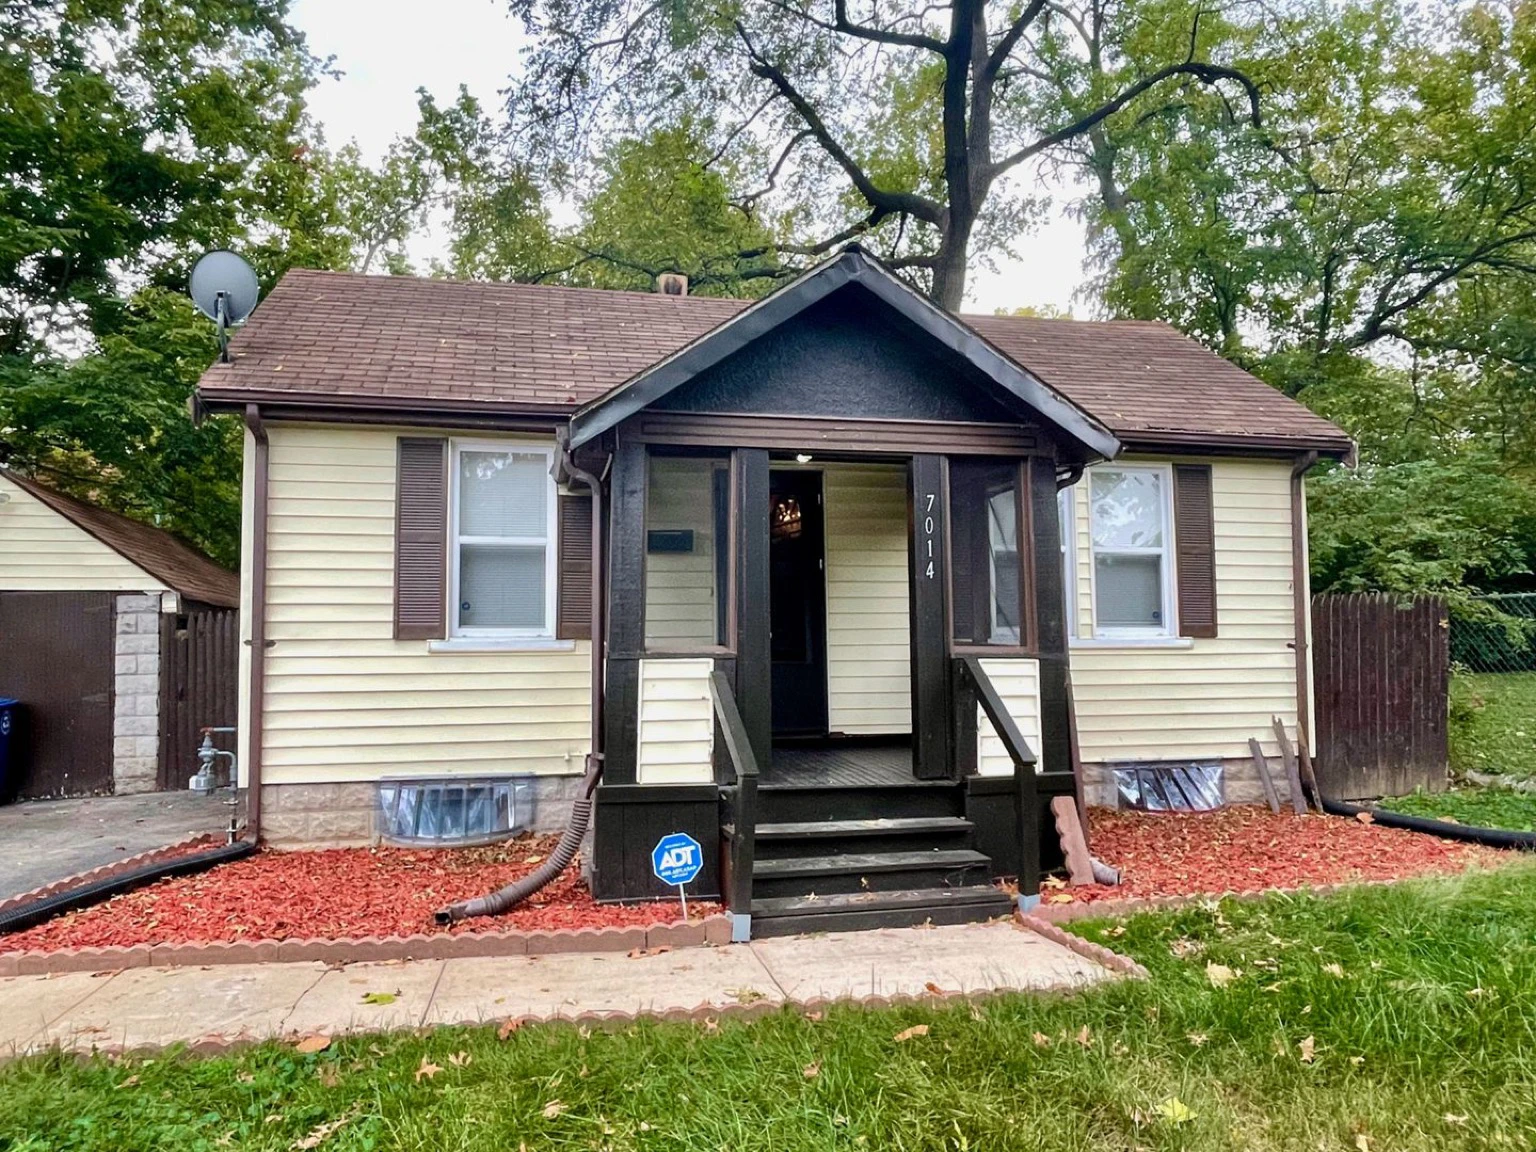
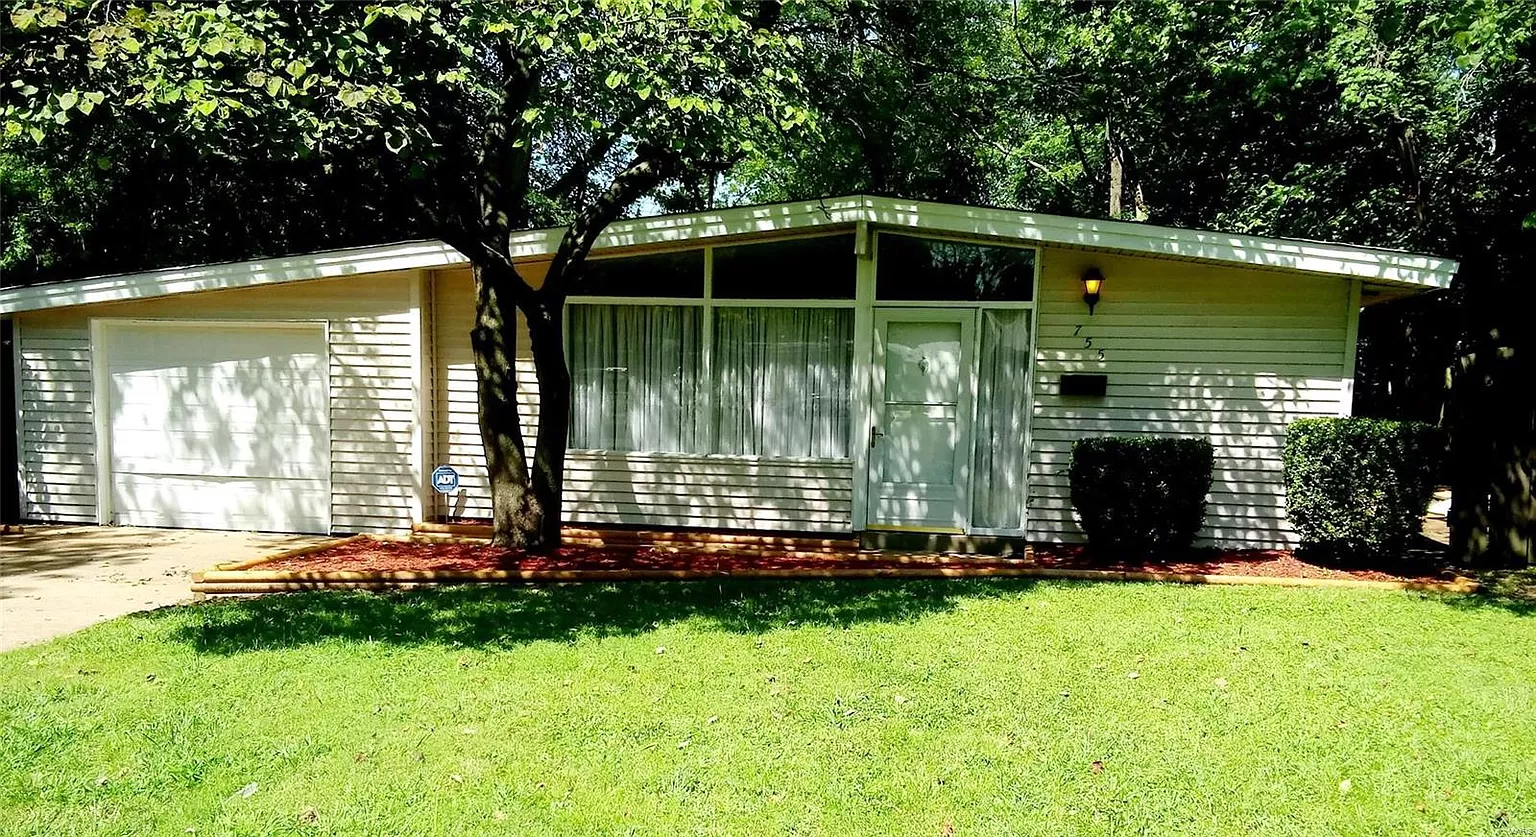
4 fractional real estate investment properties available now in St Louis.
Available investment properties in St Louis, MO
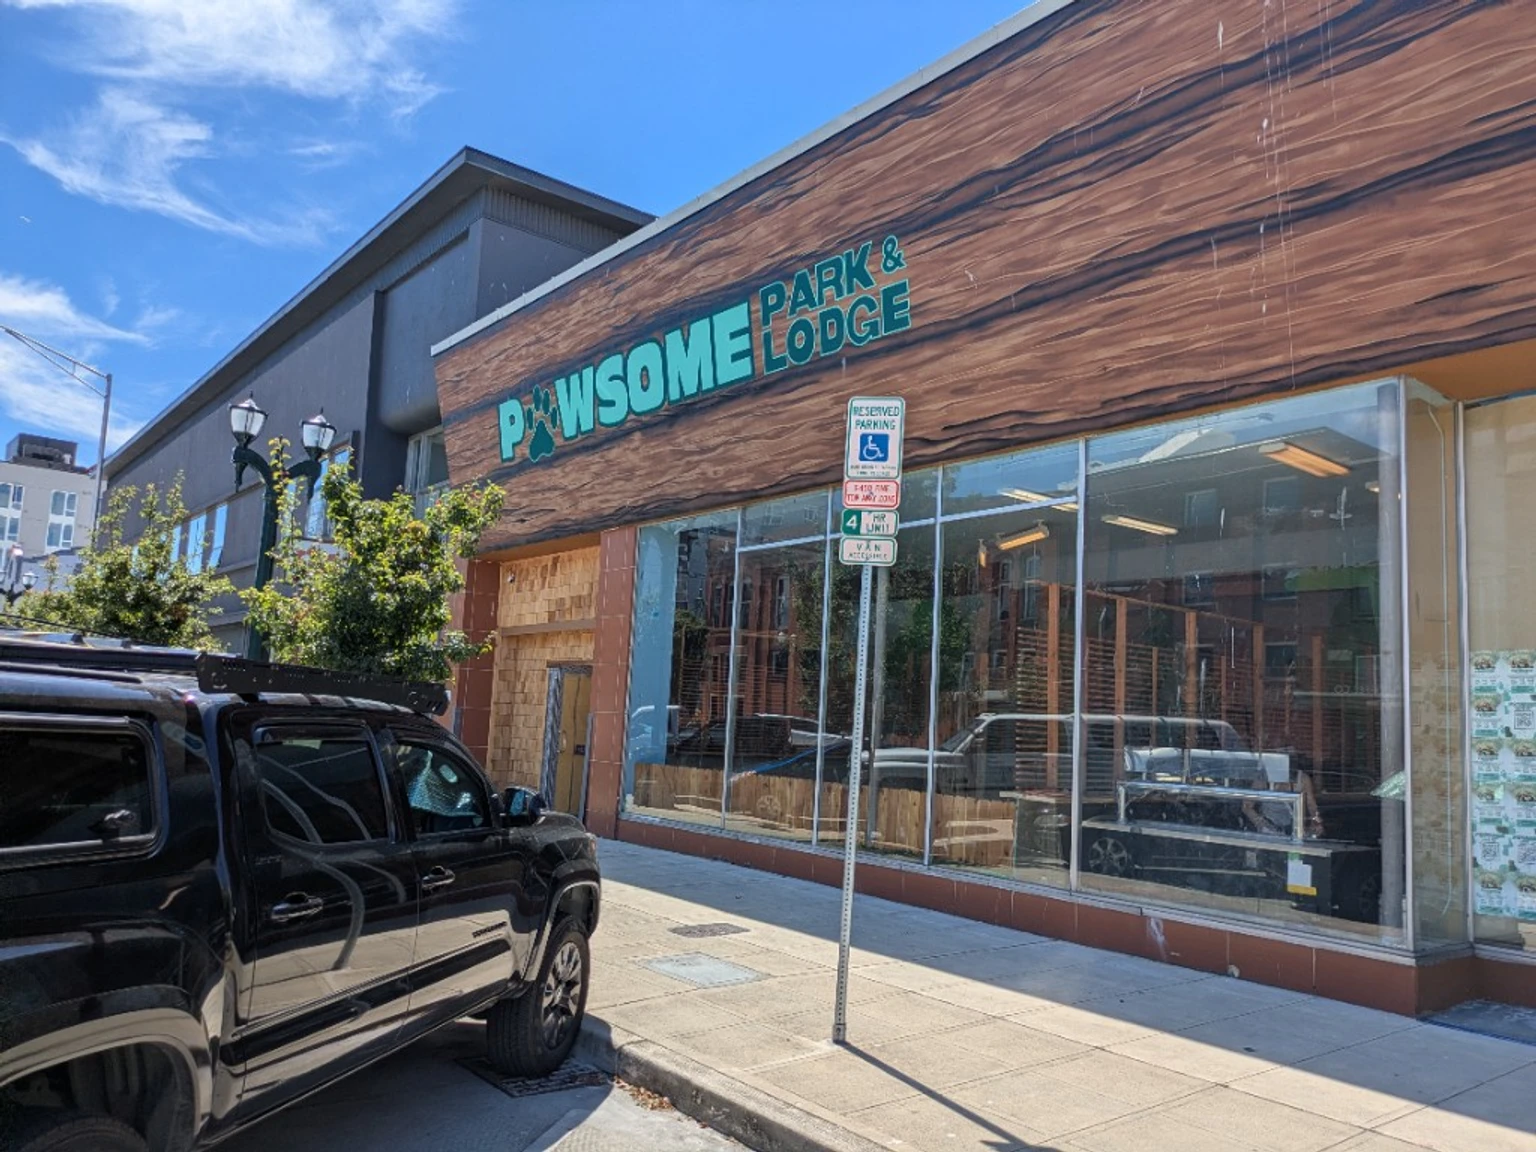
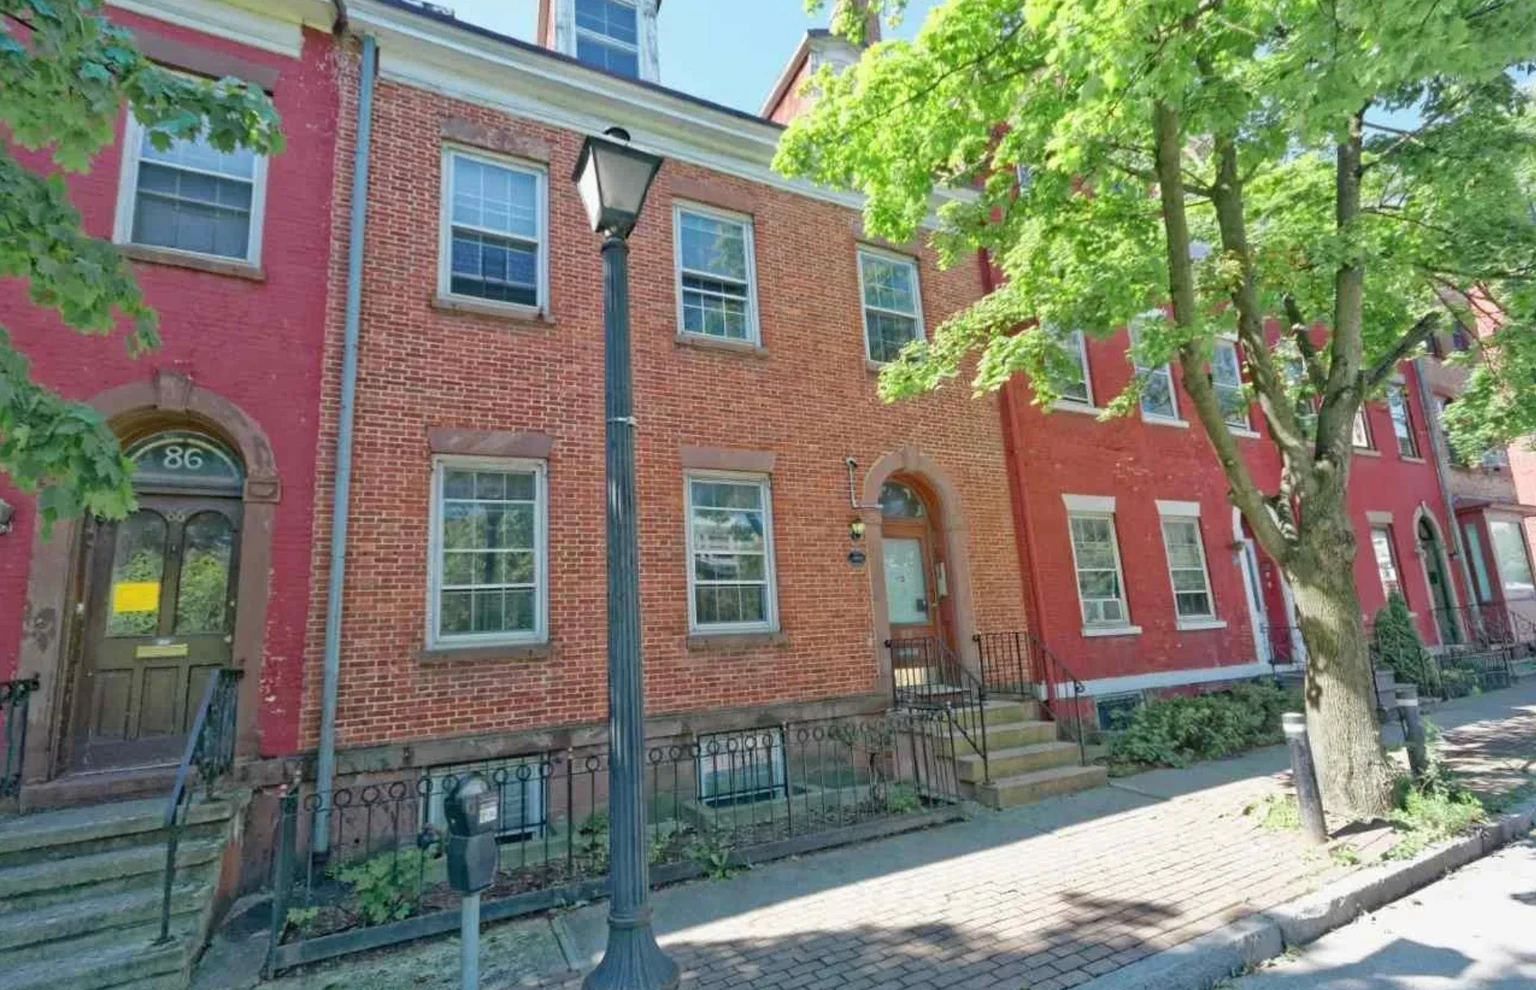
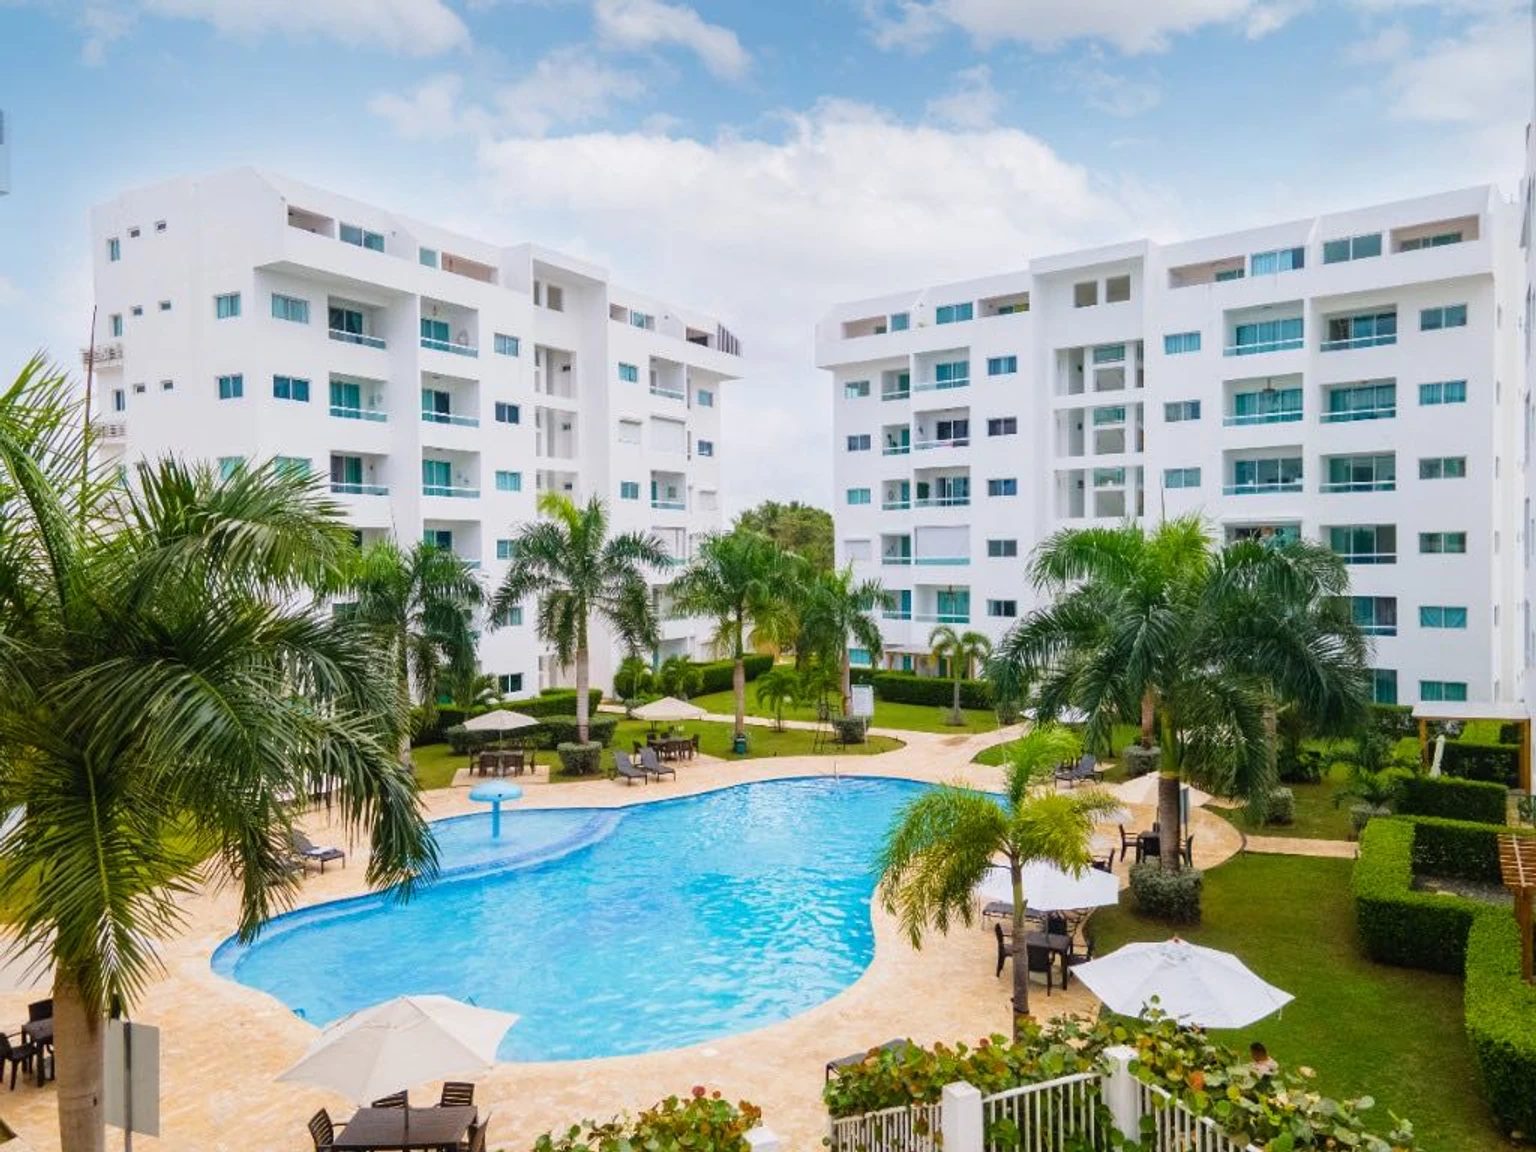
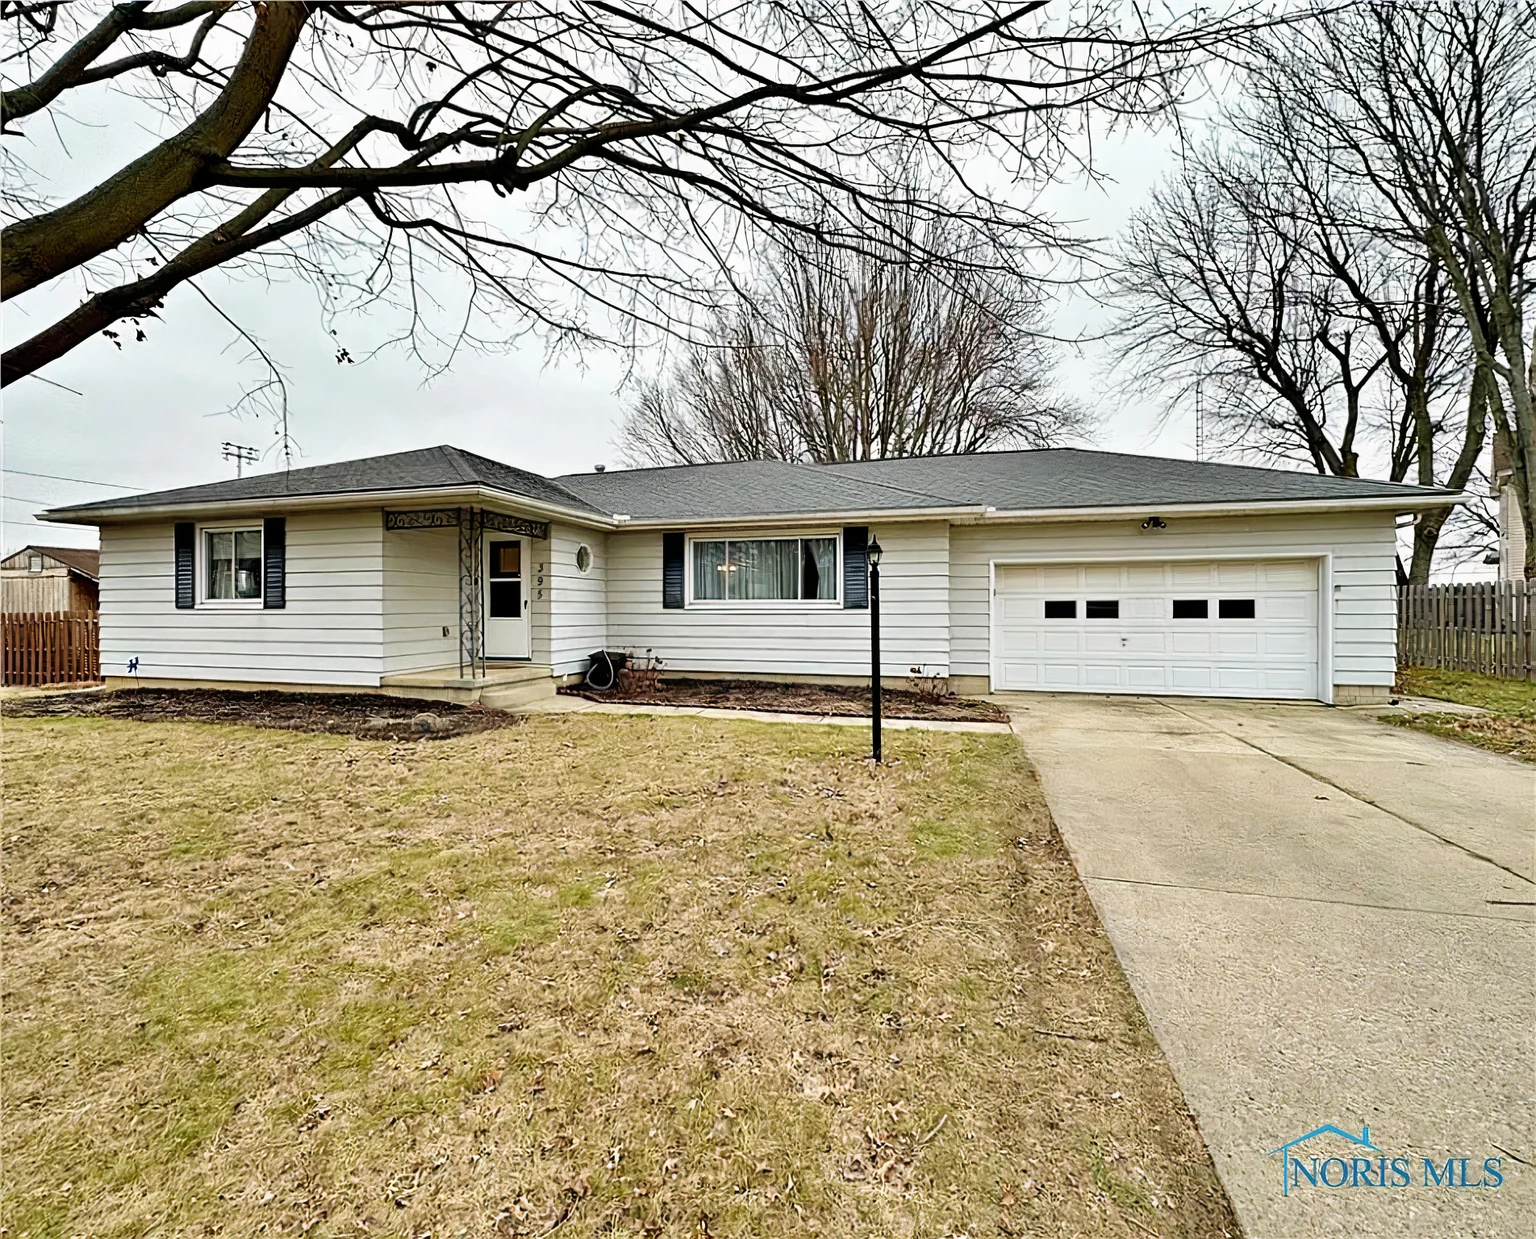
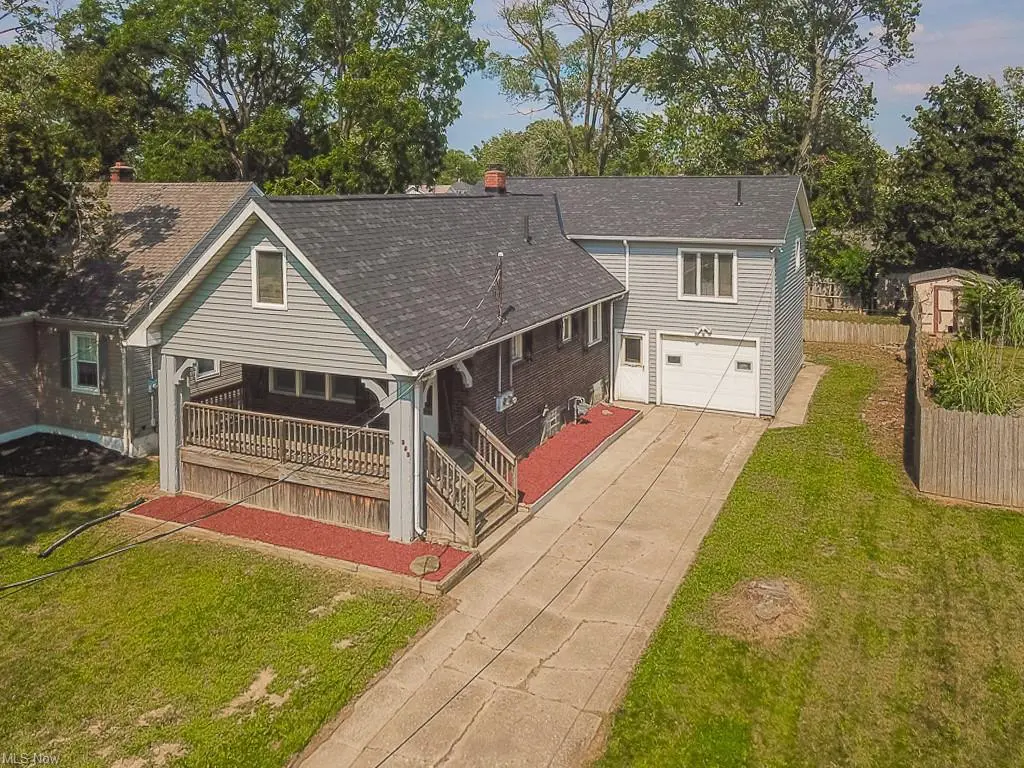
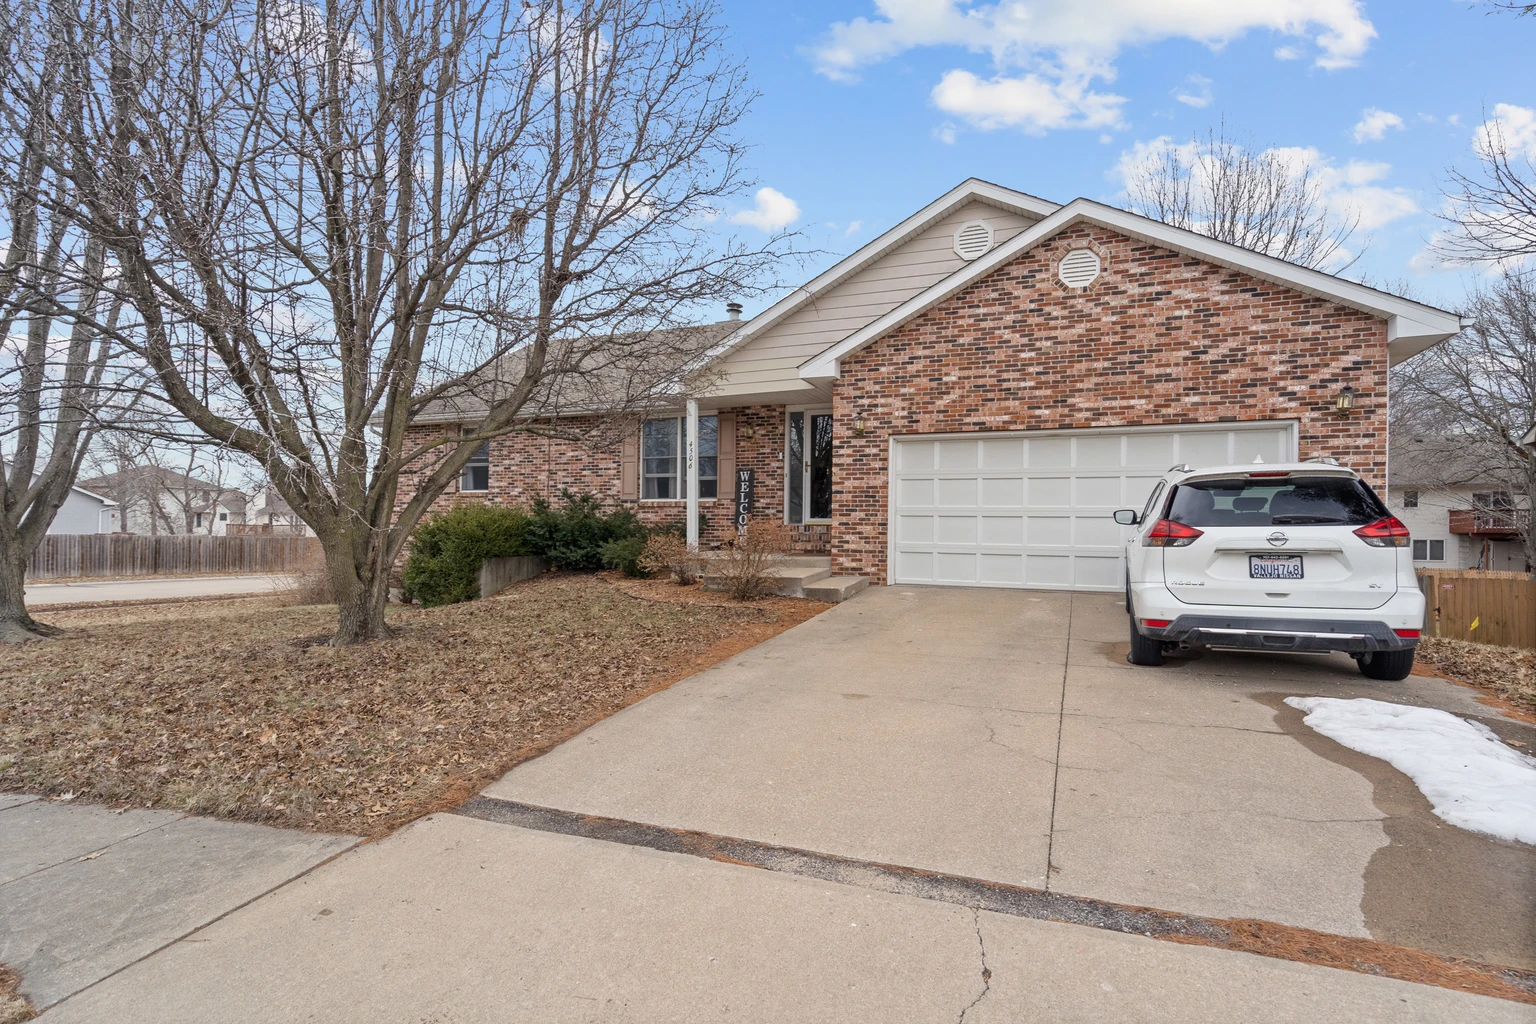
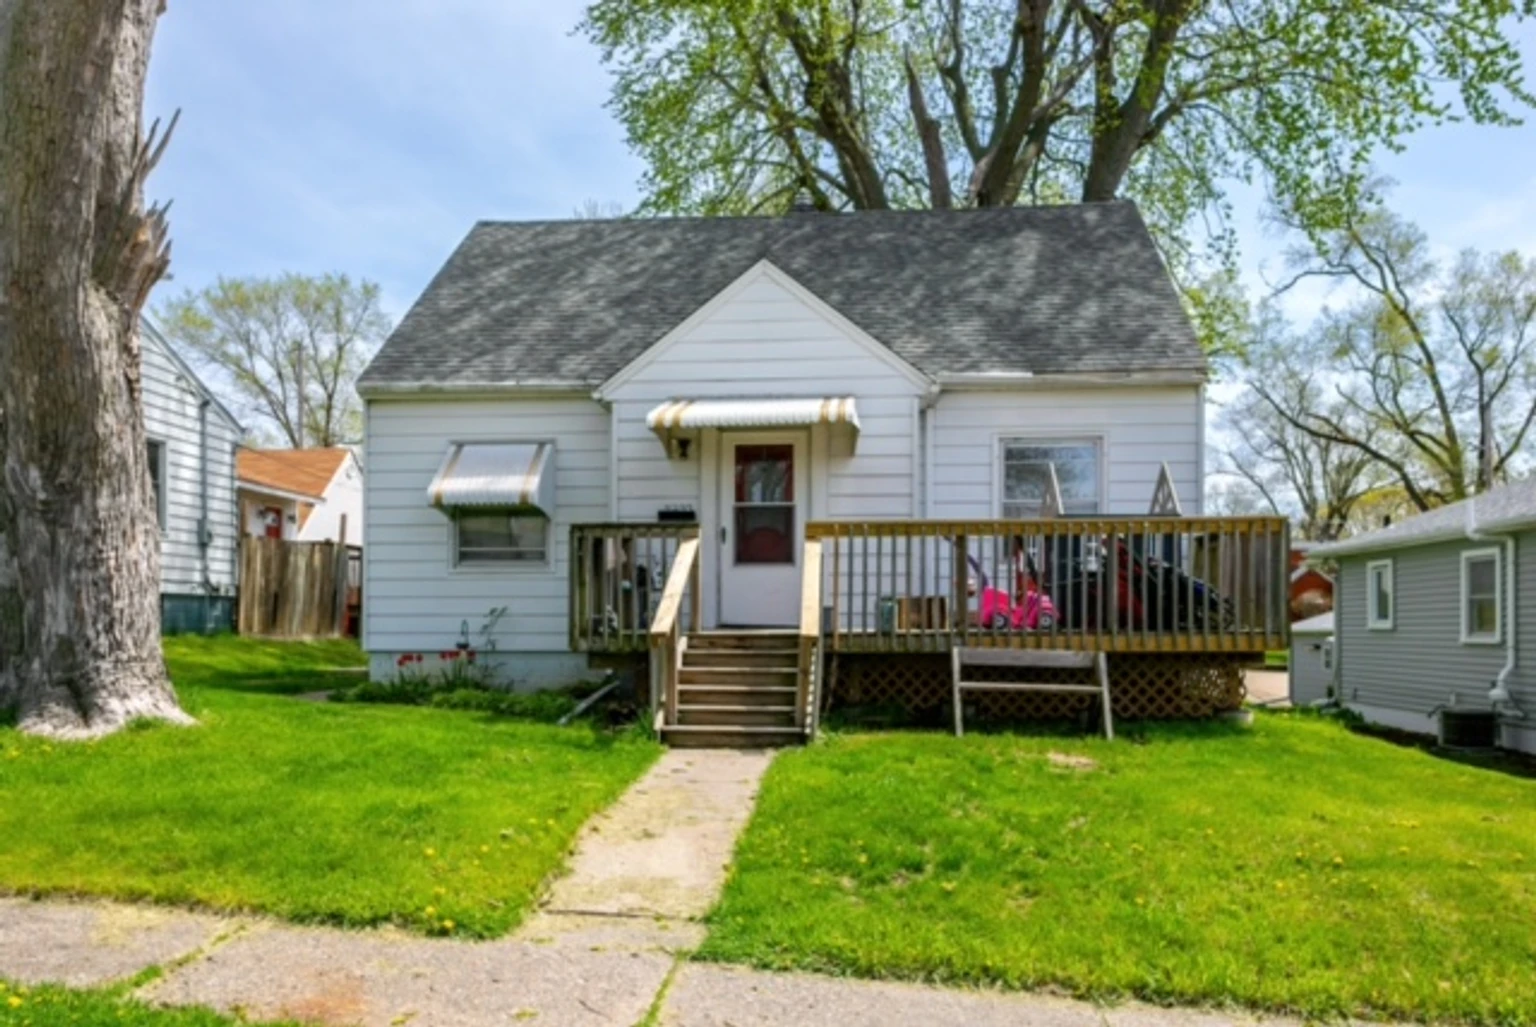
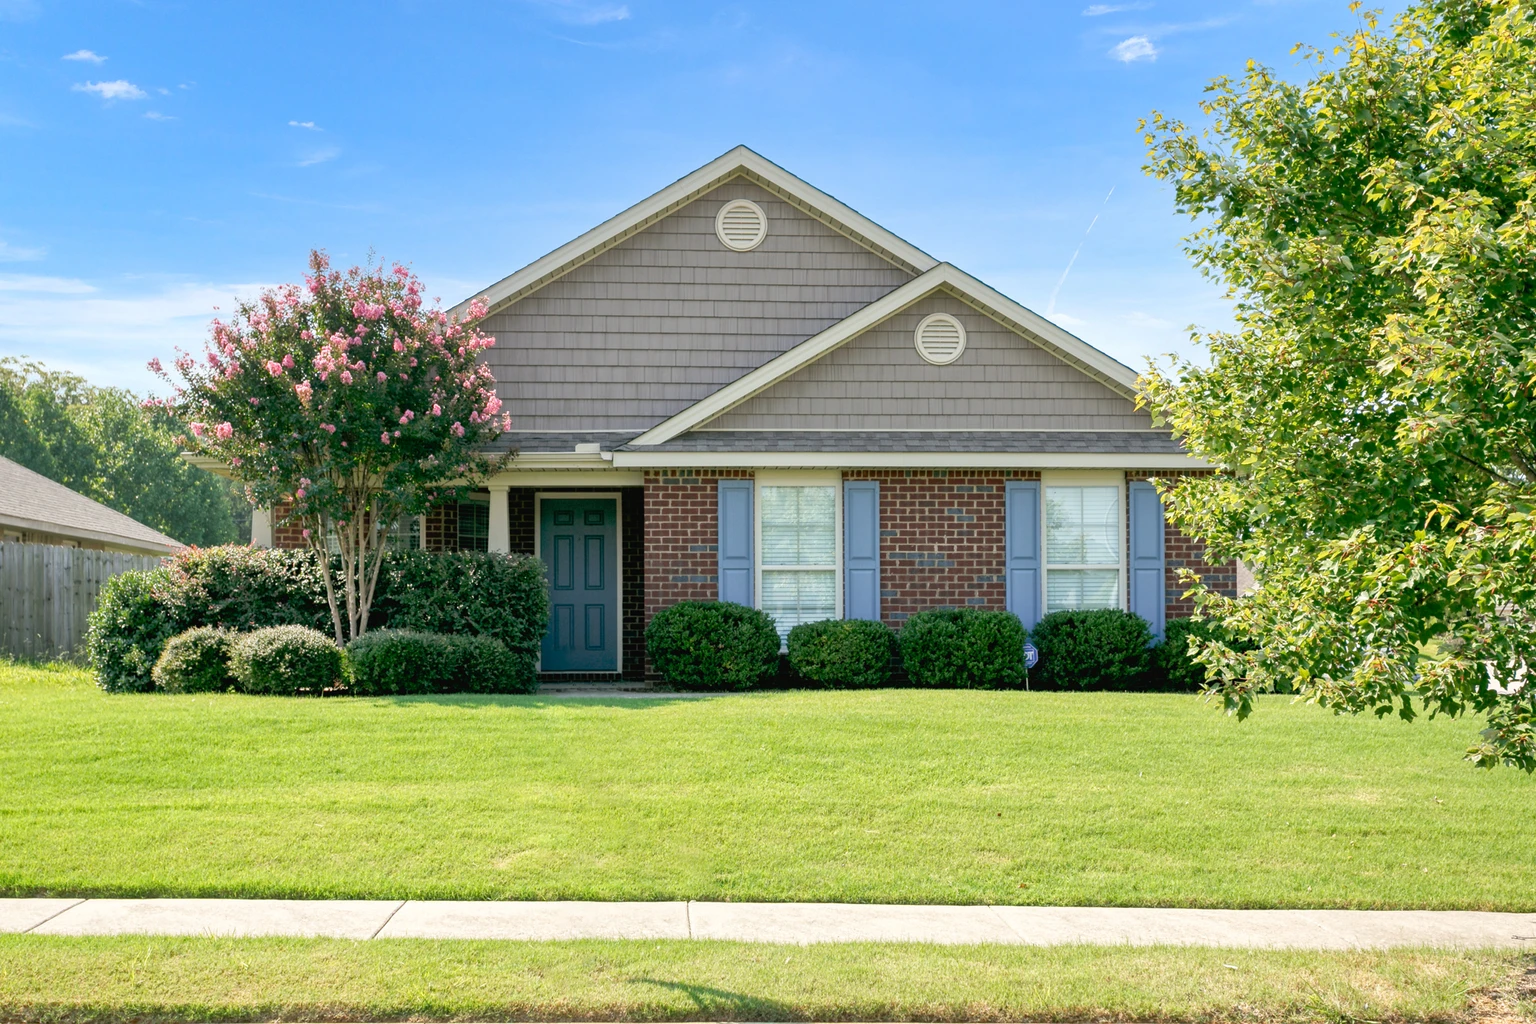
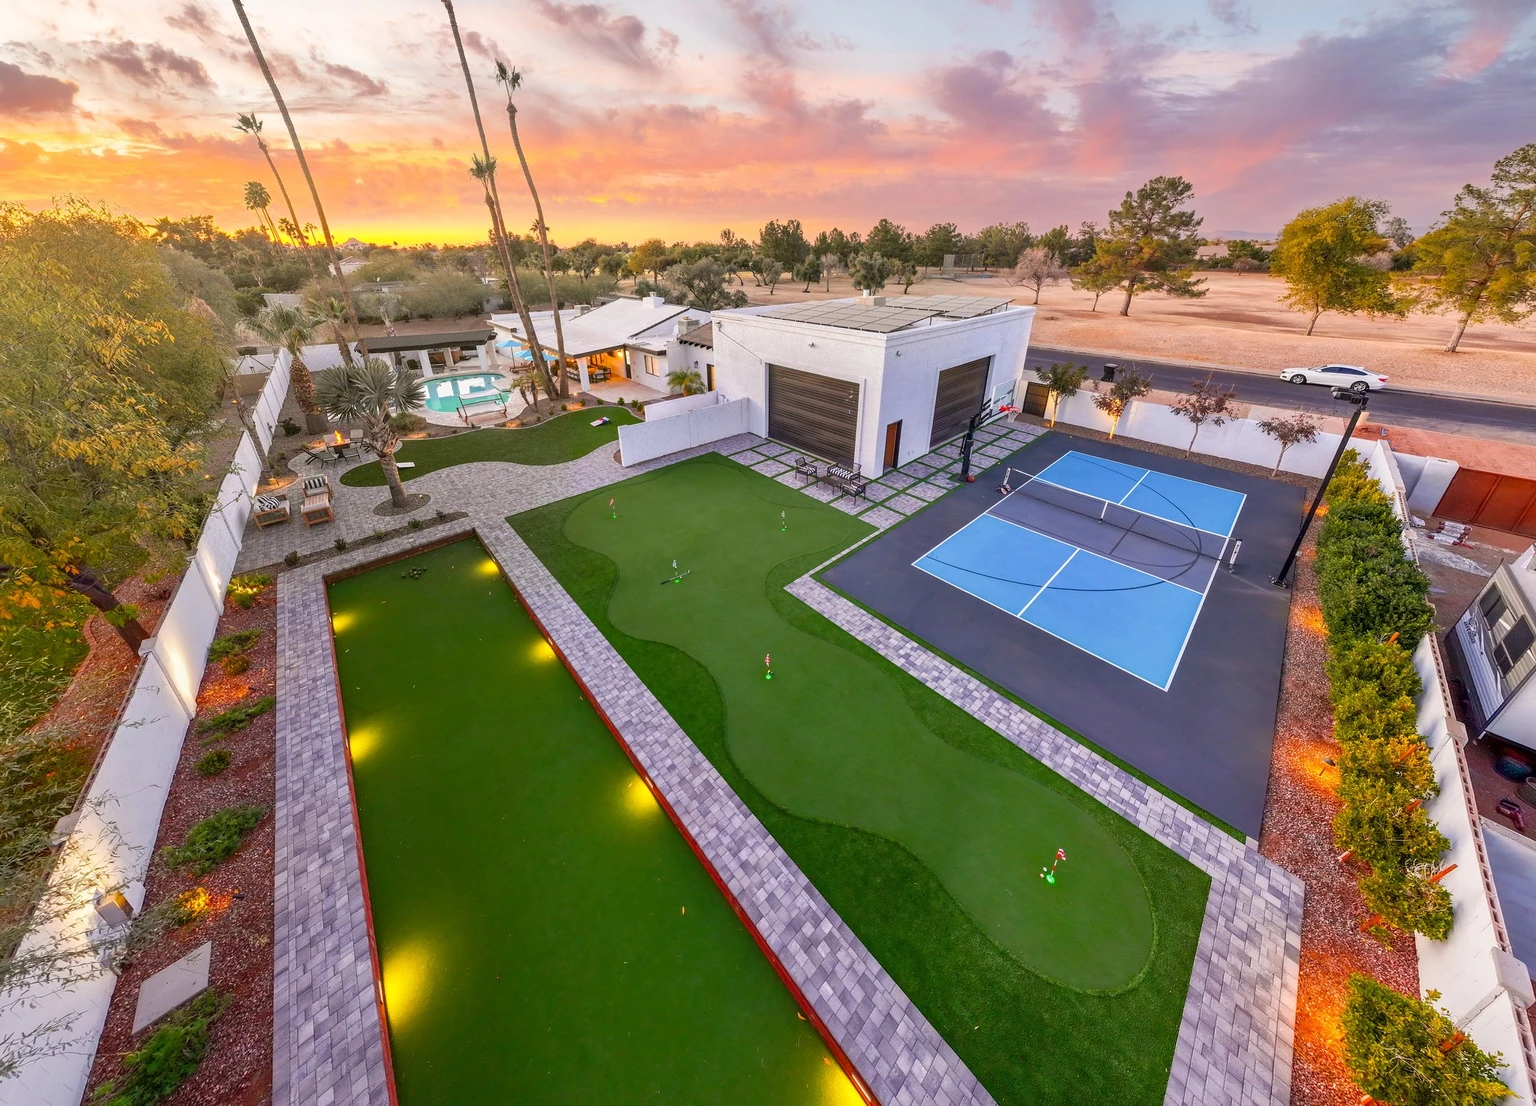
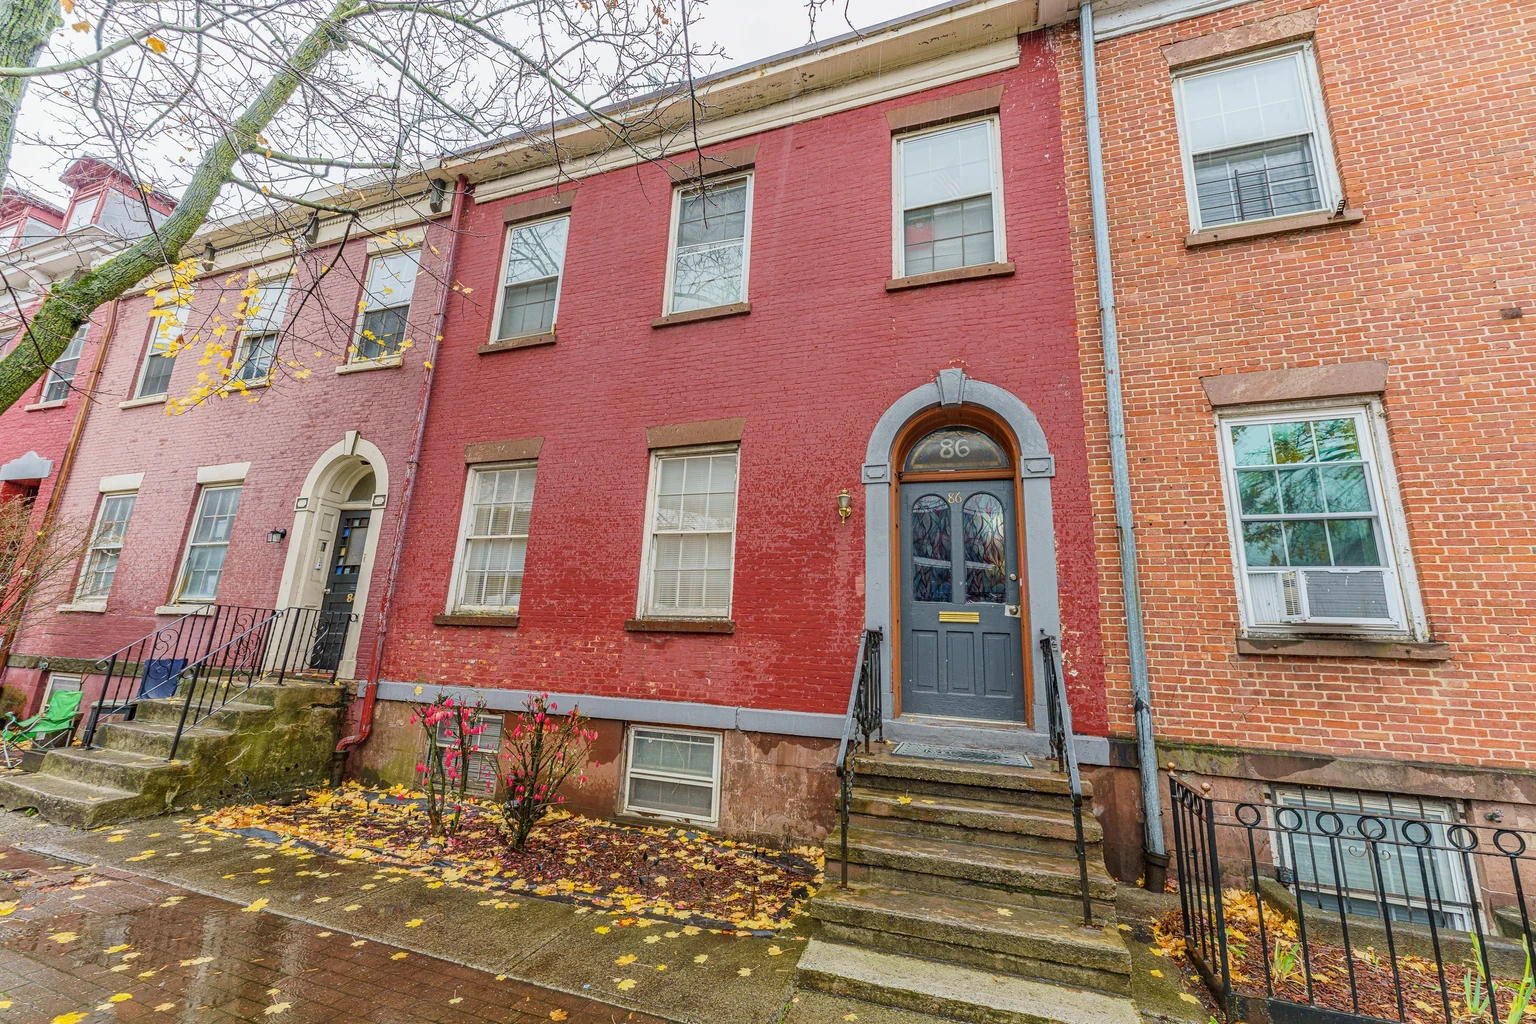
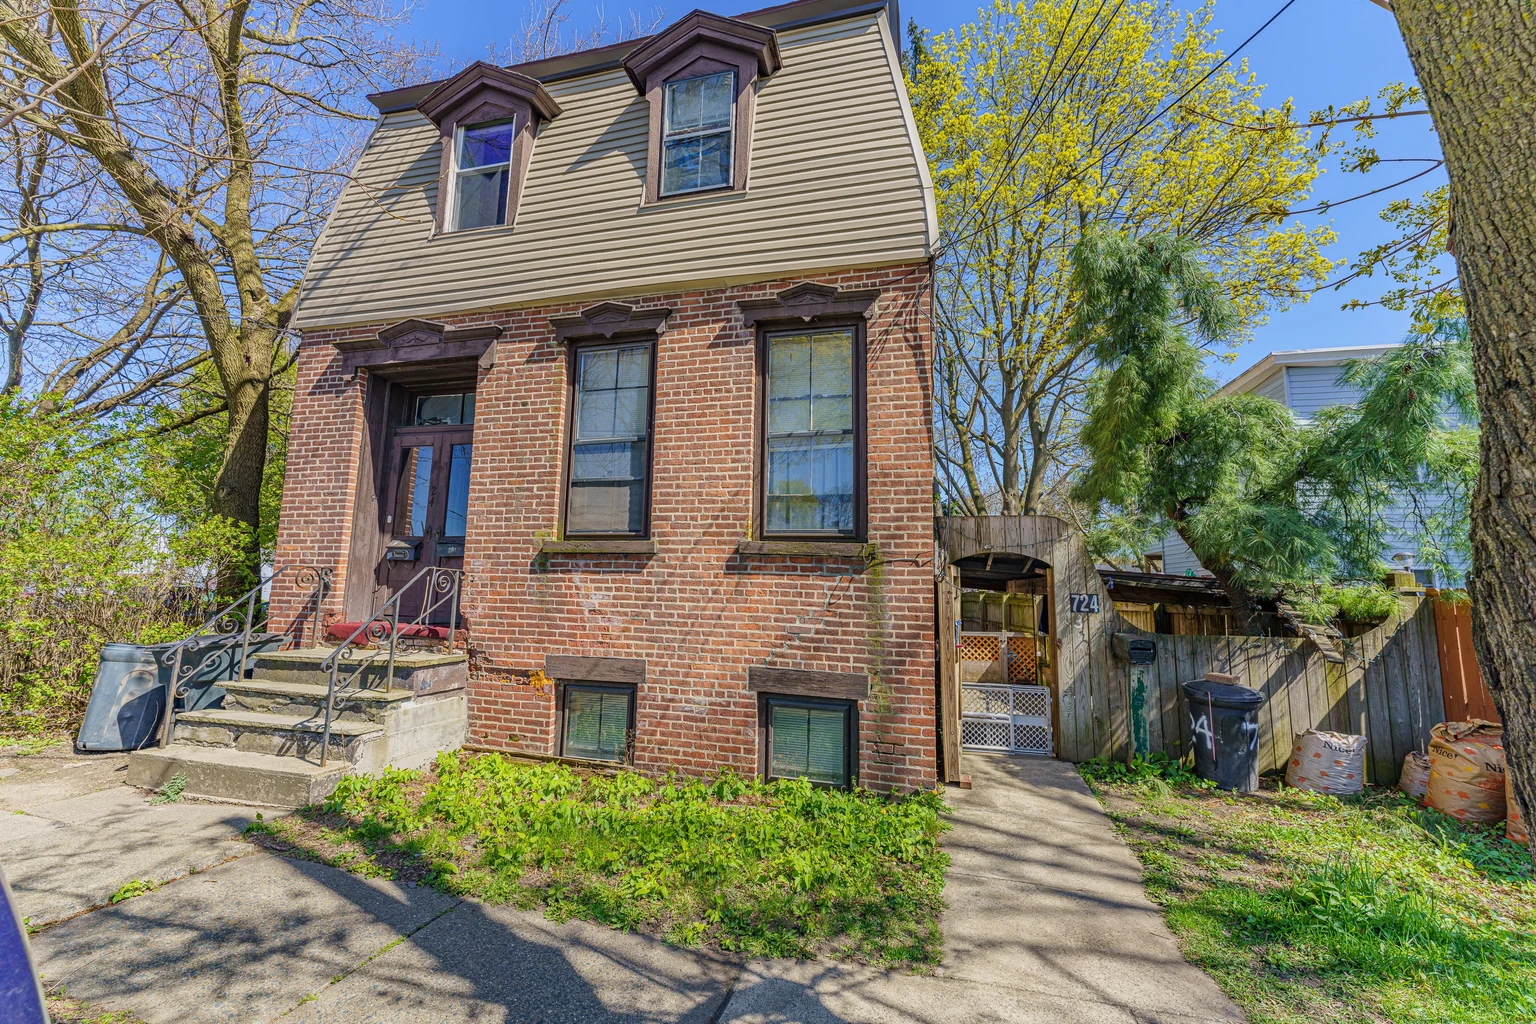
Recently Sold Investment Properties in St Louis, MO
26 previously listed properties in St Louis.








About the St Louis Real Estate Investment Market
The St. Louis real estate market in 2026 is one of the more compelling stories in the Midwest, with national outlets repeatedly flagging the metro as a top-performing market for 2026 even as Sun Belt darlings like Nashville and Austin struggle. As of late 2025 and early 2026, median sale prices in the St. Louis metro ranged from $269,950 to $285,000, up roughly 6.7-8.0% year-over-year, while St. Louis County specifically came in around $260,000 in November 2025, essentially flat year-over-year and roughly 48% below the national median. That combination of meaningful citywide price appreciation plus deep affordability is unusually rare in 2026 and explains why St. Louis is showing up on so many top-market lists.
Inventory in the St. Louis metro has rebuilt to roughly 10,351 active listings in early 2026, up about 10.8% year-over-year, with the metro now sitting on roughly 1.26-2.2 months of supply (rising toward 4 months in some submarket cuts). Days on market range from 27 days metro-wide on the most-active cuts to 52-86 days in the broader Houzeo data set, depending on the geographic slice. Only about 8% of homes in the metro are now selling over asking, down from 18.75% a year prior, signaling that buyers in St. Louis have meaningfully more leverage at the negotiating table than they did at any point in the past three years.
Beneath the metro-level data, the St. Louis market remains highly bifurcated. Highly desirable inner-ring suburbs like Kirkwood, Ladue, Clayton, and St. Louis Hills are still seeing competitive multiple-offer dynamics, while mid-county and outer-ring suburban markets show substantially more balance and longer marketing times. Inside the city of St. Louis, neighborhoods like Central West End, Tower Grove South, The Hill, Soulard, Lafayette Square, and Maplewood (in adjacent St. Louis County) continue to attract young-professional renters and short-term-rental operators thanks to walkability scores, dining density, and proximity to Forest Park, BJC HealthCare, and Washington University.
The St. Louis investment thesis has always been about cash flow and stability rather than speculative appreciation, and 2026 reinforces that view. With average home values city-wide near $183,000 and average rents around $1,358 per month, rent-to-price ratios in many St. Louis submarkets still clear the 1% rule on a pro-forma basis. Citywide cap rates remain attractive relative to coastal alternatives, and the metro's anchor employers: BJC HealthCare, SSM Health, Washington University, Boeing's defense operations, Edward Jones, Centene, Anheuser-Busch, and Bayer Crop Science, provide a remarkably steady tenant demand base across both blue-collar and white-collar segments.
Key Market Statistics for St Louis
| Median Sale Price | Inventory Level | Avg Days on Market | YoY Price Change |
|---|---|---|---|
| $278,162 | 10,351 | 52 days | +6.7% |
Source: aggregated public real estate data, as of Early 2026.
Year-Over-Year Market Comparison
St. Louis posted some of the strongest year-over-year price gains among major Midwestern metros heading into 2026, with median sale prices up 6.7-8.0% to a $269,950-$285,000 range, even as inventory simultaneously climbed roughly 10.8% to 10,351 active listings. Wage growth in the metro is now outpacing home-price growth for the first time in years, materially improving long-term affordability prospects for St. Louis buyers. At the same time, the share of homes selling over asking dropped from roughly 18.75% to 8%, days on market lengthened, and St. Louis County's November 2025 median ticked down 0.10% year-over-year to $260,000, the first hint of a moderation. The net picture is a market that is still appreciating at a healthy clip while quietly handing buyers more leverage than they've had in years, a setup that national analysts have repeatedly flagged as one of the more attractive risk/reward profiles in 2026.
Trending Neighborhoods in St Louis
- Central West End
- Tower Grove South
- The Hill
- Soulard
- Lafayette Square
- Maplewood
- Clayton
- Kirkwood
- Ladue
- St. Louis Hills
- University City (U City)
- Crestwood
In-Demand Property Types in St Louis
- Walkable urban single-family rentals in Central West End and Tower Grove South
- Historic homes in Soulard, Lafayette Square, and The Hill
- Suburban single-family rentals in Maplewood, Crestwood, and U City
- Executive-quality rentals in Clayton, Ladue, and Kirkwood
- Small multifamily duplexes and 2-4 unit properties in inner-ring city neighborhoods
Recent Market Shifts & Trends
The defining recent shift in St. Louis is the combination of meaningful price appreciation alongside a rebuild of buyer leverage. Median prices in the metro are still up 6.7-8.0% year-over-year, but the share of homes selling over asking has been cut roughly in half (from ~18.75% to ~8%), inventory is up about 10.8%, and St. Louis County specifically posted its first year-over-year median price dip in November 2025. Mortgage rates settling into the 6.0-6.8% band, paired with wage growth finally outpacing home-price growth, has improved affordability and brought rate-locked buyers back into the St. Louis market. The most desirable inner-ring suburbs: Kirkwood, Ladue, Clayton, St. Louis Hills, remain competitive with multiple-offer activity, but mid-county and outer-ring submarkets are clearly rebalancing in buyers' favor.
Expert Insights
“St. Louis is positioned as one of the strongest housing markets heading into 2026, contrasting sharply with struggling Sun Belt markets like Nashville and Austin. The metro is experiencing a healthy transition from the pandemic-era seller's market to a more balanced environment, with desirable inner-ring areas like Kirkwood, Ladue, and St. Louis Hills still competitive while mid-county suburban markets show greater balance.”
“St. Louis home prices remain approximately 48% below the national average, attracting buyers from higher-cost markets, while wage growth is now outpacing home price appreciation for the first time in years. Inventory is forecast to grow 5-10% in 2026 with median prices rising a modest 2-4%, marking sustainable growth rather than dramatic appreciation.”
“St. Louis offers a rare combination of affordability, strong rental demand, and steady economic growth, with average home values near $183,000 and average rents around $1,358 per month. Central West End, Tower Grove South, Maplewood, and Crestwood are among the strongest cash-flow neighborhoods, while Clayton remains the premier choice for executive-quality long-term rentals.”
Key Takeaways
St. Louis enters 2026 as one of the more compelling combined cash-flow-and-appreciation markets in the country. With metro medians up 6.7-8.0% year-over-year, inventory rebuilt to 10,000+ active listings, and only 8% of homes still selling over asking, investors have a rare window to capture meaningful price growth without paying peak-cycle premiums. For executive-quality long-term rentals with the cleanest tenant quality, Clayton, Ladue, and Kirkwood remain the gold standard, though entry prices and competition are highest there. For walkable short-term and mid-term rental plays, Central West End, Tower Grove South, Soulard, Lafayette Square, and The Hill offer dense restaurant scenes, proximity to BJC HealthCare and Washington University, and strong young-professional demand. For yield-focused buy-and-hold investors, Maplewood, Crestwood, and U City offer the best balance of affordability, school quality, and tenant tenure. The St. Louis metro's 48%-below-national-median price point, anchor employer base in healthcare, defense, and consumer goods, and forecast 2-4% price appreciation for 2026 make it one of the more defensible Midwestern markets for capital that wants both downside protection and modest upside through the next cycle.
Frequently Asked Questions About St Louis Real Estate
Is St Louis, MO a good market for fractional real estate investing?
St. Louis enters 2026 as one of the more compelling combined cash-flow-and-appreciation markets in the country. With metro medians up 6.7-8.0% year-over-year, inventory rebuilt to 10,000+ active listings, and only 8% of homes still selling over asking, investors have a rare window to capture meaningful price growth without paying peak-cycle premiums. For executive-quality long-term rentals with the cleanest tenant quality, Clayton, Ladue, and Kirkwood remain the gold standard, though entry prices and competition are highest there. For walkable short-term and mid-term rental plays, Central West End, Tower Grove South, Soulard, Lafayette Square, and The Hill offer dense restaurant scenes, proximity to BJC HealthCare and Washington University, and strong young-professional demand. For yield-focused buy-and-hold investors, Maplewood, Crestwood, and U City offer the best balance of affordability, school quality, and tenant tenure. The St. Louis metro's 48%-below-national-median price point, anchor employer base in healthcare, defense, and consumer goods, and forecast 2-4% price appreciation for 2026 make it one of the more defensible Midwestern markets for capital that wants both downside protection and modest upside through the next cycle.
What is the median sale price in St Louis, MO?
The median sale price in St Louis, MO is approximately $278,162 as of Early 2026.
What are trending neighborhoods in St Louis, MO?
Trending neighborhoods in St Louis, MO include Central West End, Tower Grove South, The Hill, Soulard, Lafayette Square, Maplewood.
What property types are in demand for investment properties in St Louis, MO?
In-demand investment property types in St Louis, MO include Walkable urban single-family rentals in Central West End and Tower Grove South, Historic homes in Soulard, Lafayette Square, and The Hill, Suburban single-family rentals in Maplewood, Crestwood, and U City, Executive-quality rentals in Clayton, Ladue, and Kirkwood.
Data Sources
- St. Louis Magazine, 2026 Outlook
- Houzeo St. Louis Housing Market
- eMetropolitan St. Louis Market Report
- Fox 2 Now, 2026 Housing Hot Spots
- Stacker, St. Louis 2025 Year in Review
- St. Louis Real Estate News
- OurTaxPartner, Cash Flow Neighborhoods
- Listalysis, Central West End
- Benzinga, St. Louis Investing Outlook
- St. Louis Fed (FRED), Days on Market
- Realtor.com Research, November 2025
Other Investment Property Markets Near St Louis
Explore fractional real estate investment properties in other U.S. markets on Lofty.
- Investment Properties in Fallwood, MO
- Investment Properties in Kansas City, MO
- Investment Properties in Saint Albans, MO
- Investment Properties in Acton, CA
- Investment Properties in Akron, OH
- Investment Properties in Albany, NY
- Investment Properties in Albuquerque, NM
- Investment Properties in Atlanta, GA
- Investment Properties in Atlantic City, NJ
- Investment Properties in Austin, TX
- Investment Properties in Avon Park, FL
- Investment Properties in Baltimore, MD