'/%3e%3cpath%20d='M110.5%2074.84L61.56%20113.3V150.04H0V87.4L110.5%200V74.84Z'%20fill='url(%23paint1_linear_1102_1766)'/%3e%3cpath%20d='M159.44%20150.04L159.44%20205.81H159.2L110.5%20166.53L61.8001%20205.81H61.5601L61.56%20150.04L110.5%20110.57L159.44%20150.04Z'%20fill='url(%23paint2_linear_1102_1766)'/%3e%3cpath%20d='M110.5%20110.57V166.53L61.8001%20205.81H61.5601L61.56%20150.04L110.5%20110.57Z'%20fill='url(%23paint3_linear_1102_1766)'/%3e%3cpath%20d='M159.44%20206H61.5601L61.8001%20205.81L110.5%20166.53L159.2%20205.81L159.44%20206Z'%20fill='url(%23paint4_linear_1102_1766)'/%3e%3cdefs%3e%3clinearGradient%20id='paint0_linear_1102_1766'%20x1='166'%20y1='-19.908'%20x2='145.641'%20y2='227.731'%20gradientUnits='userSpaceOnUse'%3e%3cstop%20stop-color='%23B5AAFF'/%3e%3cstop%20offset='0.723958'%20stop-color='%238977FF'/%3e%3c/linearGradient%3e%3clinearGradient%20id='paint1_linear_1102_1766'%20x1='64'%20y1='15.7891'%20x2='172.309'%20y2='257.652'%20gradientUnits='userSpaceOnUse'%3e%3cstop%20stop-color='%239383FF'/%3e%3cstop%20offset='0.75'%20stop-color='%234D3FED'/%3e%3c/linearGradient%3e%3clinearGradient%20id='paint2_linear_1102_1766'%20x1='171.462'%20y1='36.6188'%20x2='8.598'%20y2='270.272'%20gradientUnits='userSpaceOnUse'%3e%3cstop%20offset='0.229167'%20stop-color='%23B5AAFF'/%3e%3cstop%20offset='0.994792'%20stop-color='%238977FF'/%3e%3c/linearGradient%3e%3clinearGradient%20id='paint3_linear_1102_1766'%20x1='55.7219'%20y1='-31.3876'%20x2='76.8187'%20y2='349.172'%20gradientUnits='userSpaceOnUse'%3e%3cstop%20offset='0.307292'%20stop-color='%239383FF'/%3e%3cstop%20offset='0.854167'%20stop-color='%234D3FED'/%3e%3c/linearGradient%3e%3clinearGradient%20id='paint4_linear_1102_1766'%20x1='110'%20y1='271'%20x2='76.5255'%20y2='202.314'%20gradientUnits='userSpaceOnUse'%3e%3cstop%20stop-color='%23B5AAFF'/%3e%3cstop%20offset='0.90625'%20stop-color='%238977FF'/%3e%3c/linearGradient%3e%3c/defs%3e%3c/svg%3e)
'/%3e%3cpath%20d='M110.5%2074.84L61.56%20113.3V150.04H0V87.4L110.5%200V74.84Z'%20fill='url(%23paint1_linear_1102_1752)'/%3e%3cpath%20d='M159.44%20150.04L159.44%20205.81H159.2L110.5%20166.53L61.8001%20205.81H61.5601L61.56%20150.04L110.5%20110.57L159.44%20150.04Z'%20fill='url(%23paint2_linear_1102_1752)'/%3e%3cpath%20d='M110.5%20110.57V166.53L61.8001%20205.81H61.5601L61.56%20150.04L110.5%20110.57Z'%20fill='url(%23paint3_linear_1102_1752)'/%3e%3cpath%20d='M159.44%20206H61.5601L61.8001%20205.81L110.5%20166.53L159.2%20205.81L159.44%20206Z'%20fill='url(%23paint4_linear_1102_1752)'/%3e%3cdefs%3e%3clinearGradient%20id='paint0_linear_1102_1752'%20x1='166'%20y1='-19.908'%20x2='145.641'%20y2='227.731'%20gradientUnits='userSpaceOnUse'%3e%3cstop%20stop-color='%23B5AAFF'/%3e%3cstop%20offset='0.723958'%20stop-color='%238977FF'/%3e%3c/linearGradient%3e%3clinearGradient%20id='paint1_linear_1102_1752'%20x1='64'%20y1='15.7891'%20x2='172.309'%20y2='257.652'%20gradientUnits='userSpaceOnUse'%3e%3cstop%20stop-color='%239383FF'/%3e%3cstop%20offset='0.75'%20stop-color='%234D3FED'/%3e%3c/linearGradient%3e%3clinearGradient%20id='paint2_linear_1102_1752'%20x1='171.462'%20y1='36.6188'%20x2='8.598'%20y2='270.272'%20gradientUnits='userSpaceOnUse'%3e%3cstop%20offset='0.229167'%20stop-color='%23B5AAFF'/%3e%3cstop%20offset='0.994792'%20stop-color='%238977FF'/%3e%3c/linearGradient%3e%3clinearGradient%20id='paint3_linear_1102_1752'%20x1='55.7219'%20y1='-31.3876'%20x2='76.8187'%20y2='349.172'%20gradientUnits='userSpaceOnUse'%3e%3cstop%20offset='0.307292'%20stop-color='%239383FF'/%3e%3cstop%20offset='0.854167'%20stop-color='%234D3FED'/%3e%3c/linearGradient%3e%3clinearGradient%20id='paint4_linear_1102_1752'%20x1='110'%20y1='271'%20x2='76.5255'%20y2='202.314'%20gradientUnits='userSpaceOnUse'%3e%3cstop%20stop-color='%23B5AAFF'/%3e%3cstop%20offset='0.90625'%20stop-color='%238977FF'/%3e%3c/linearGradient%3e%3c/defs%3e%3c/svg%3e)
Investment Properties in Chicago, IL
6 fractional real estate investment properties available now in Chicago.
Available investment properties in Chicago, IL
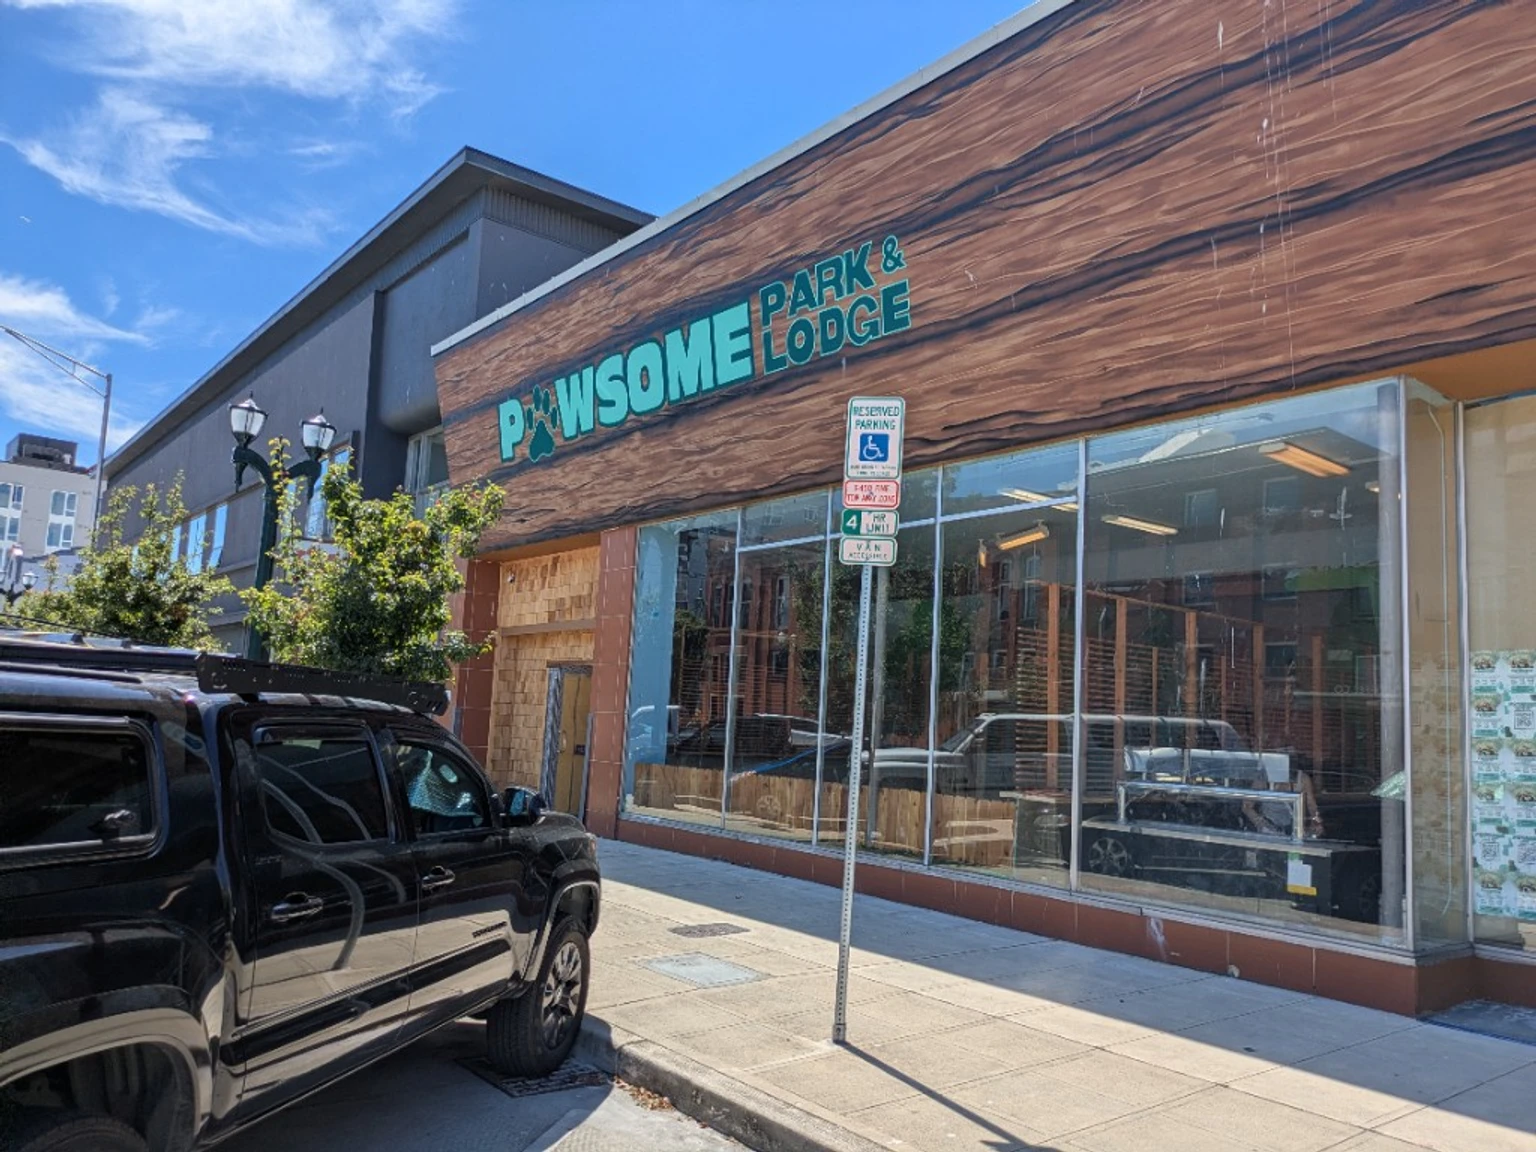
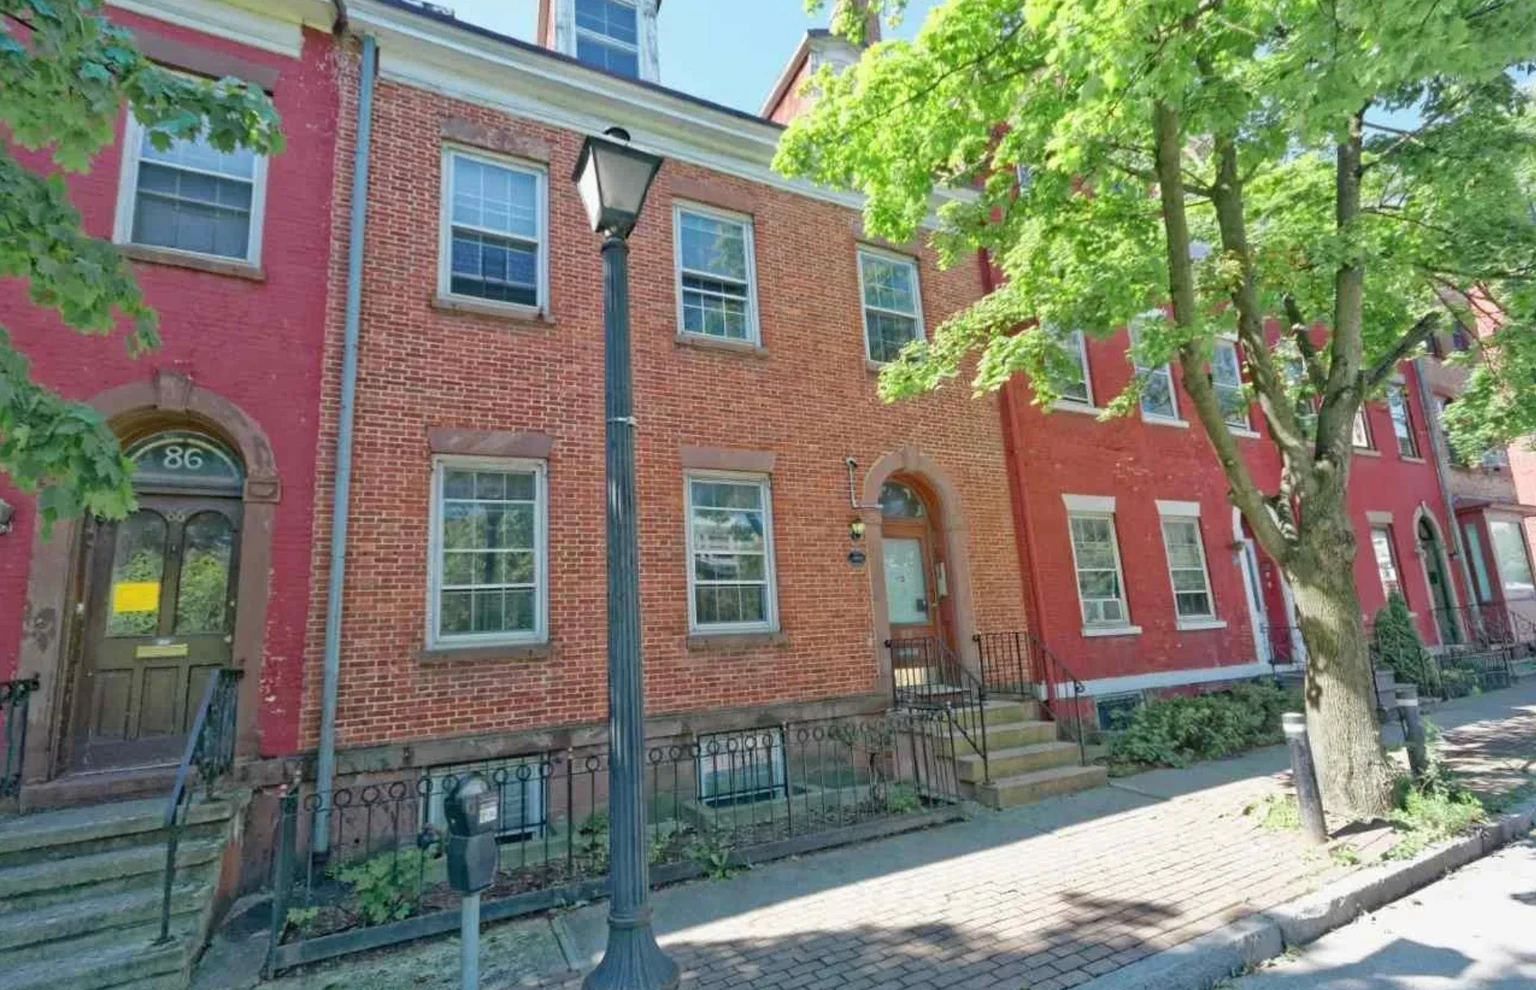
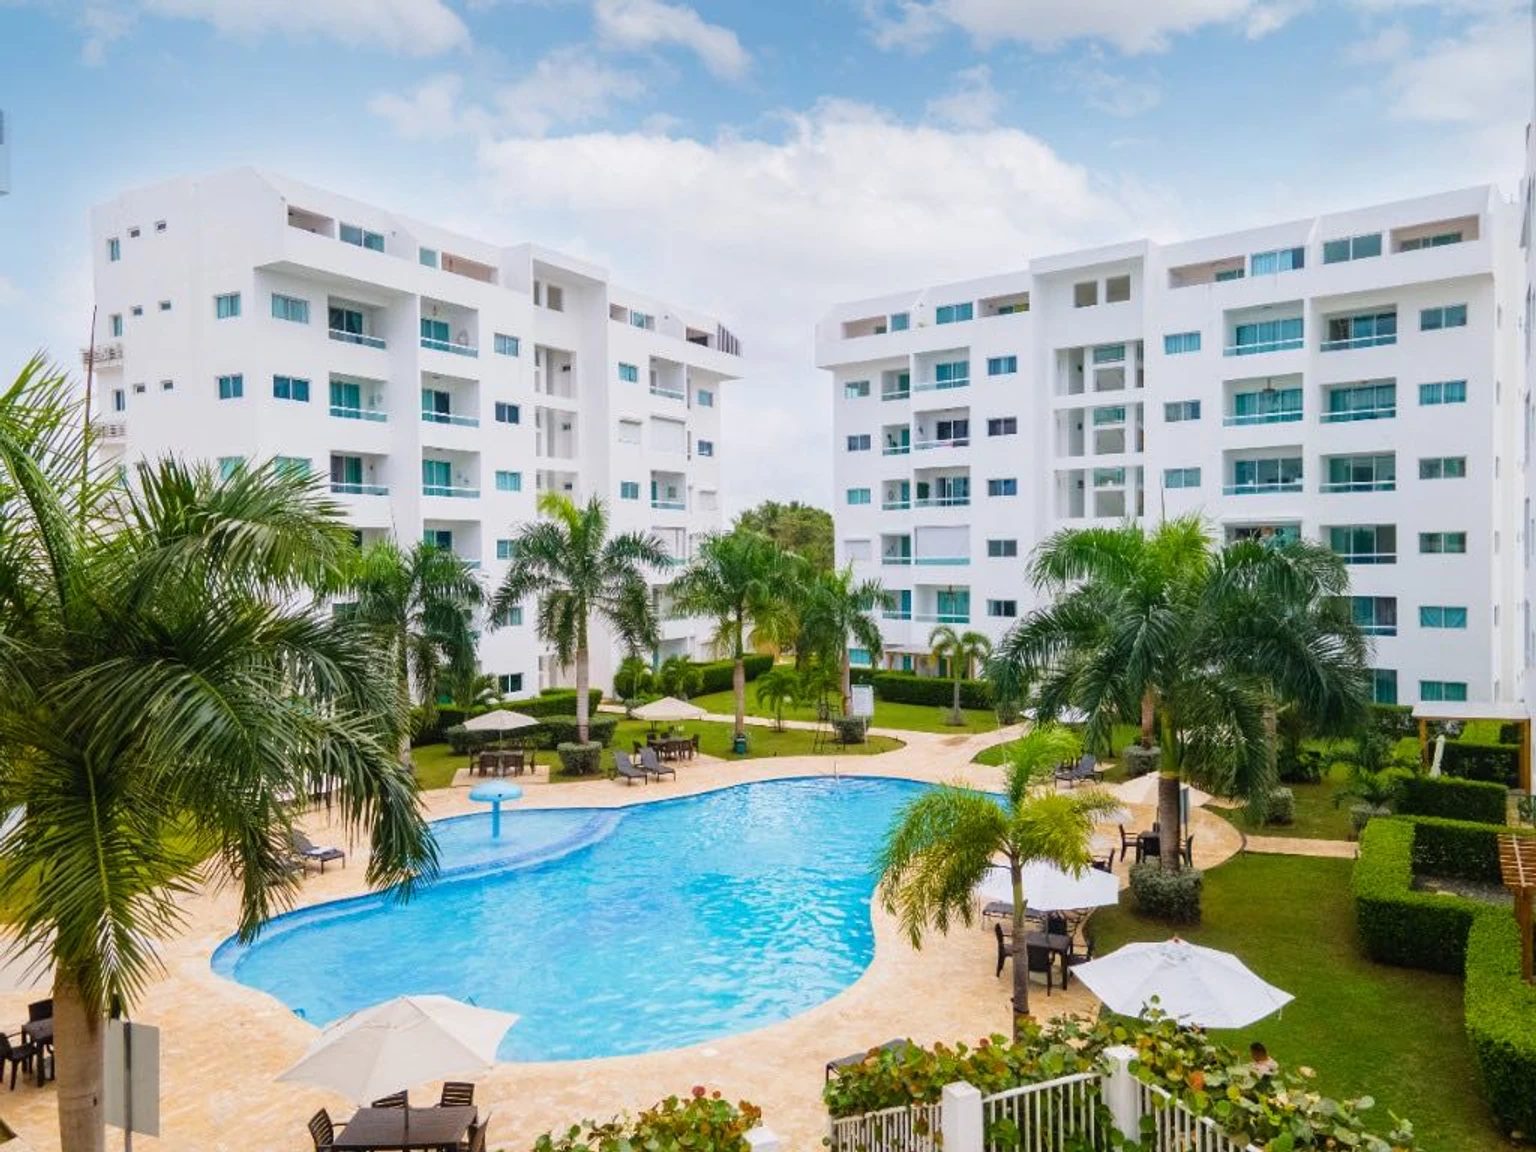
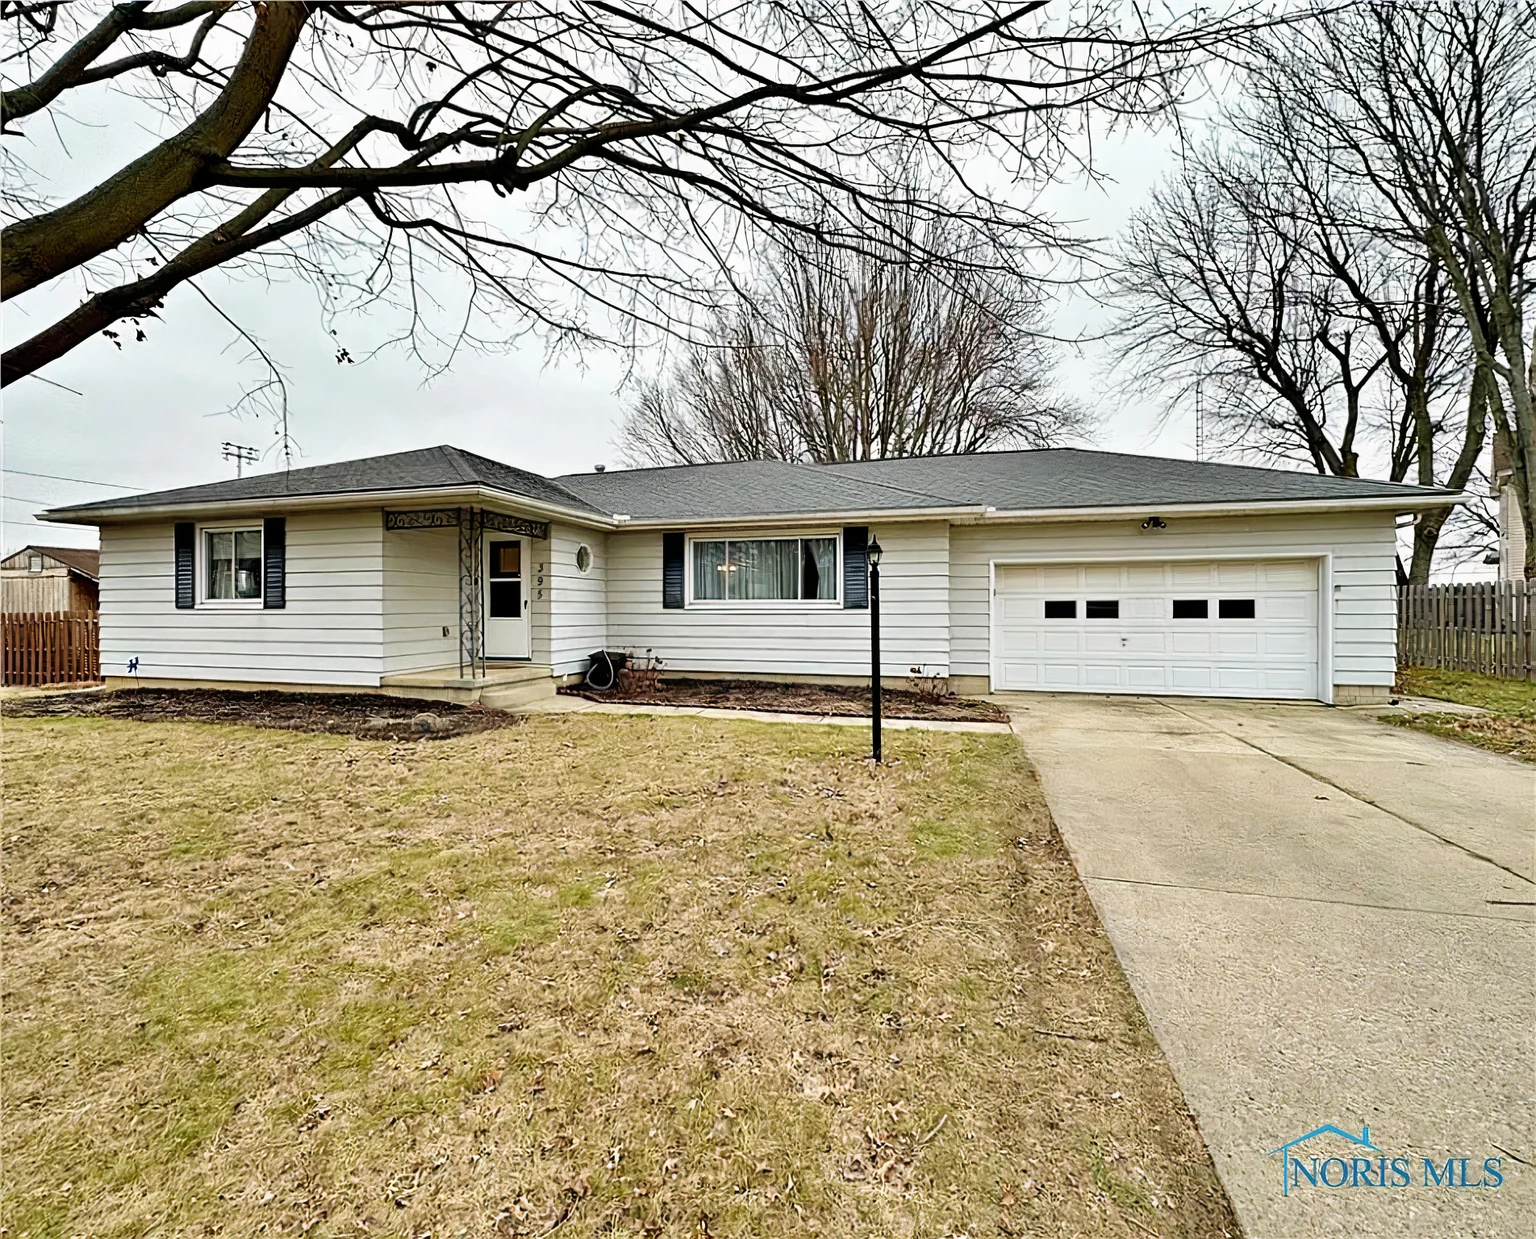
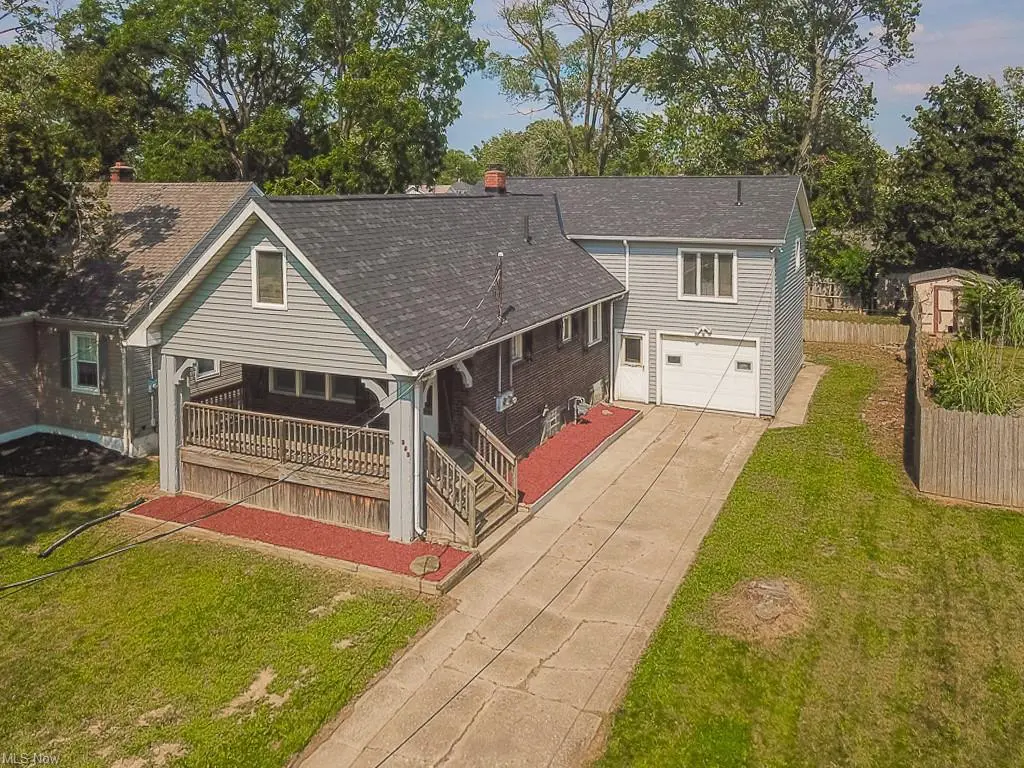
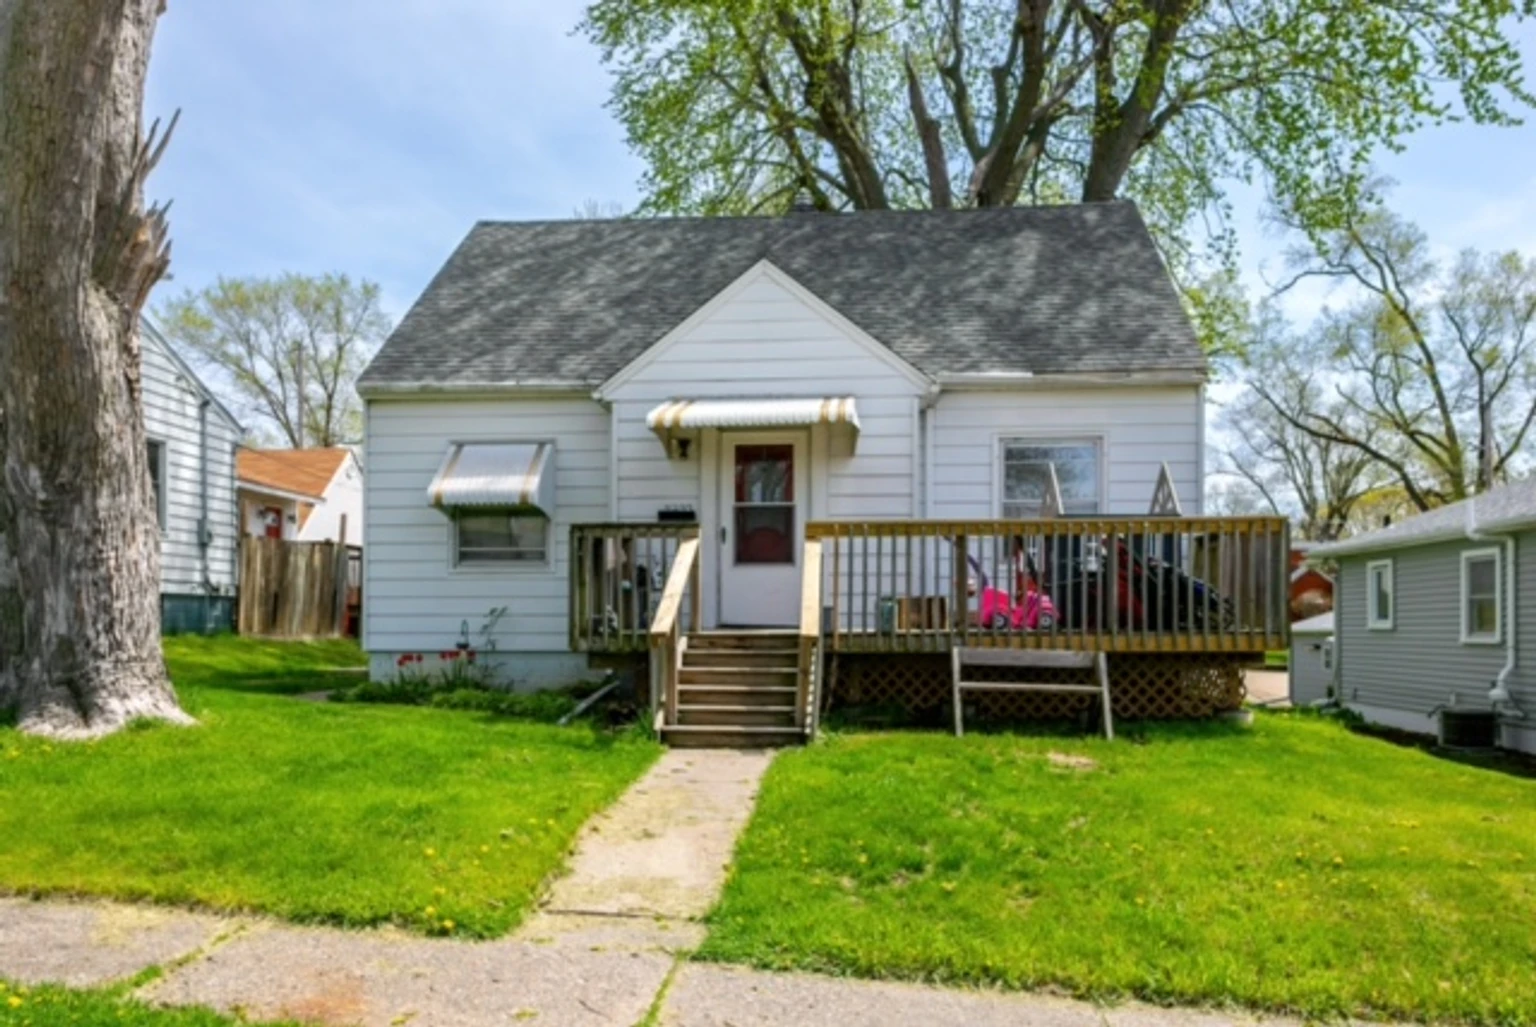
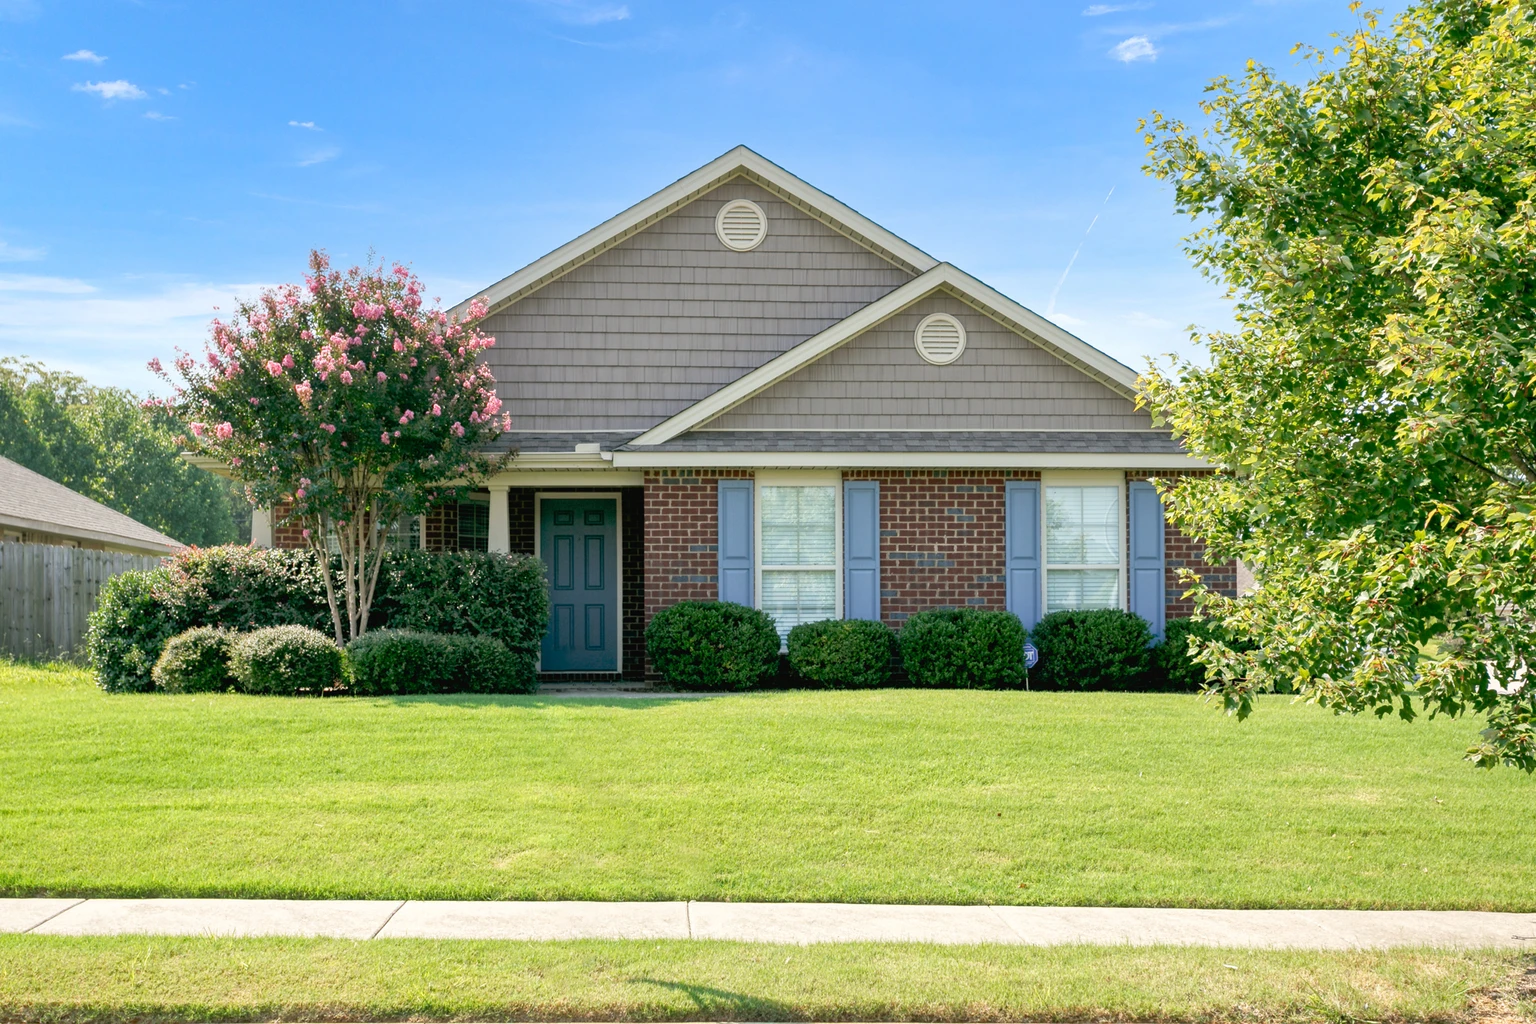
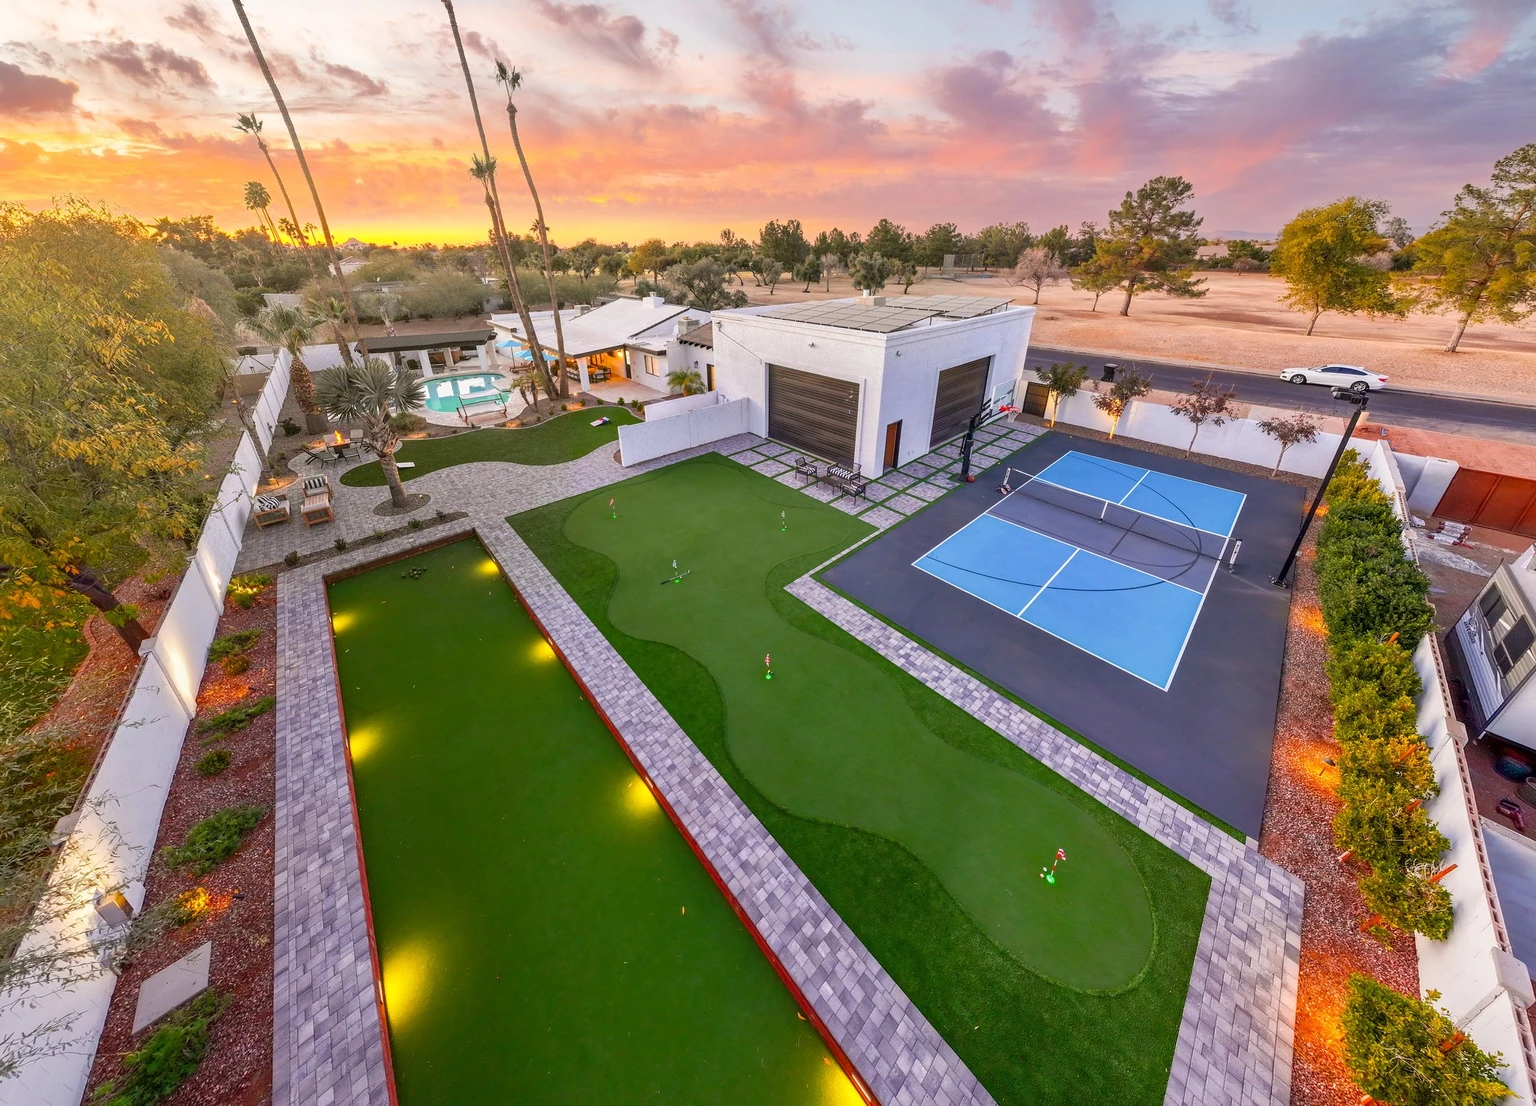
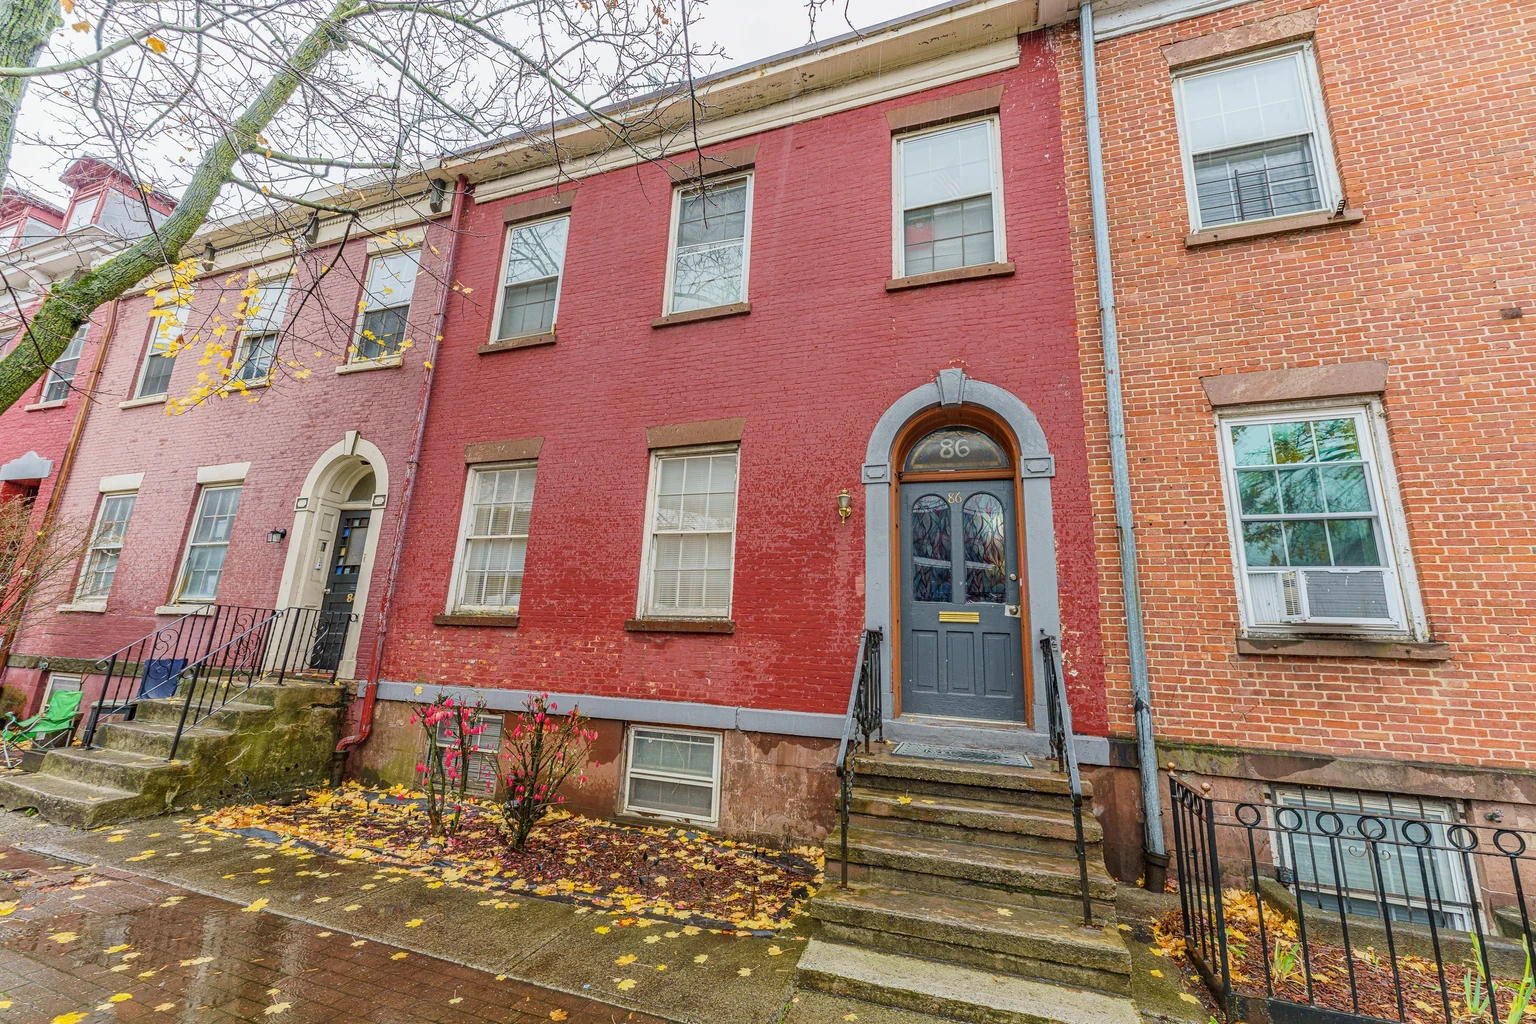
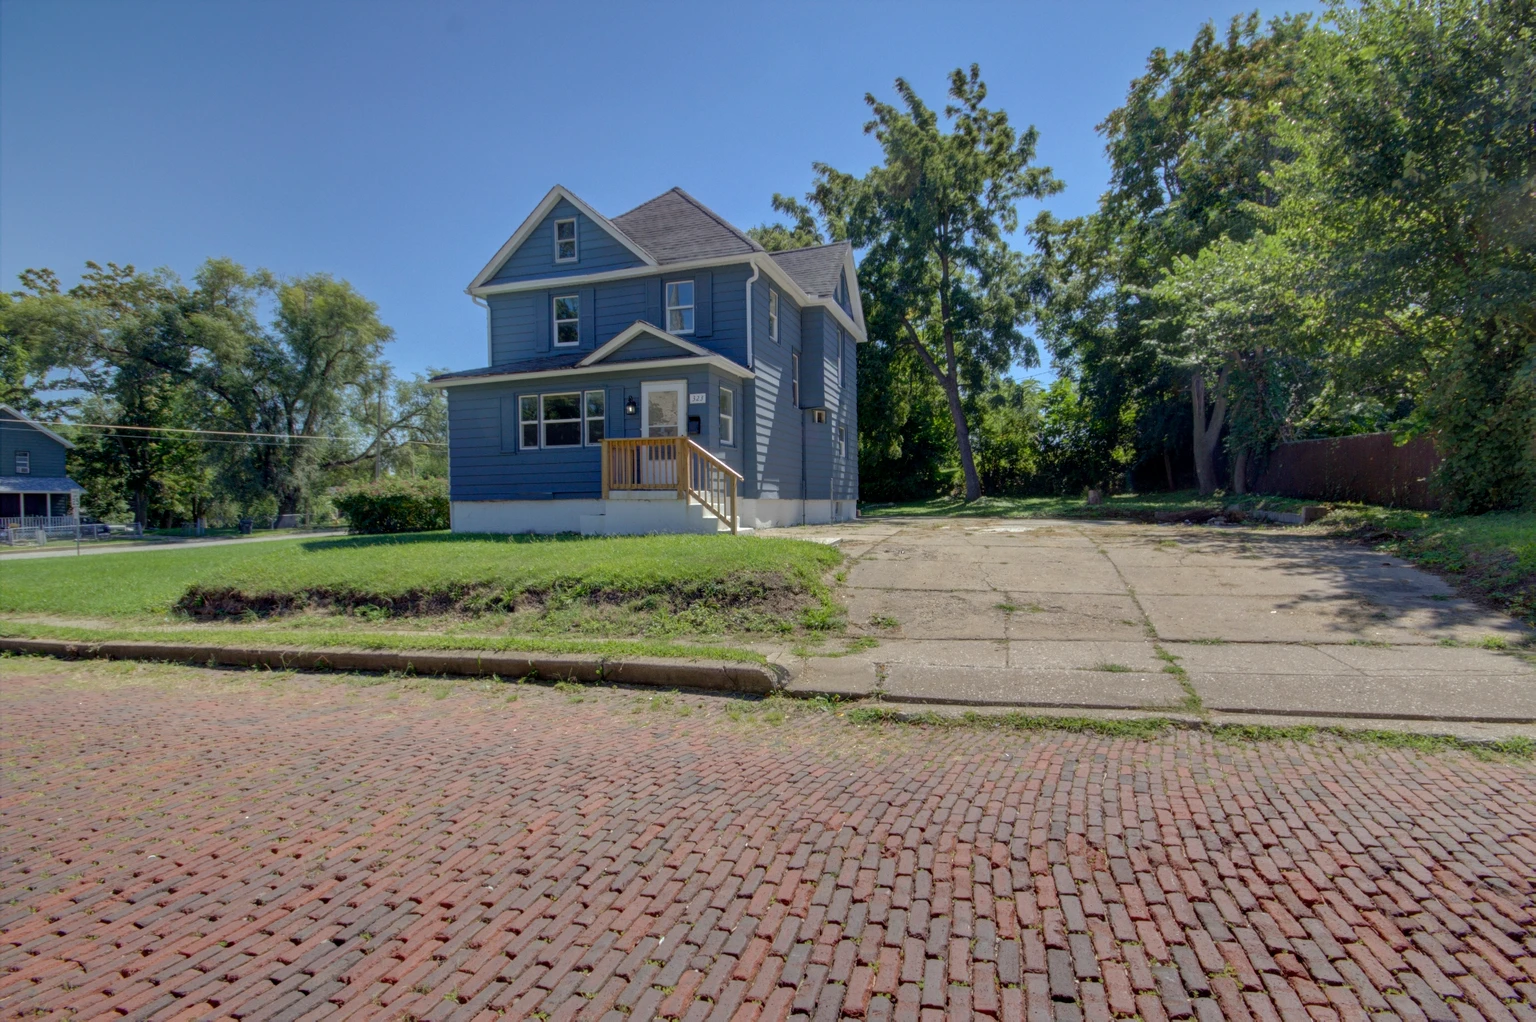
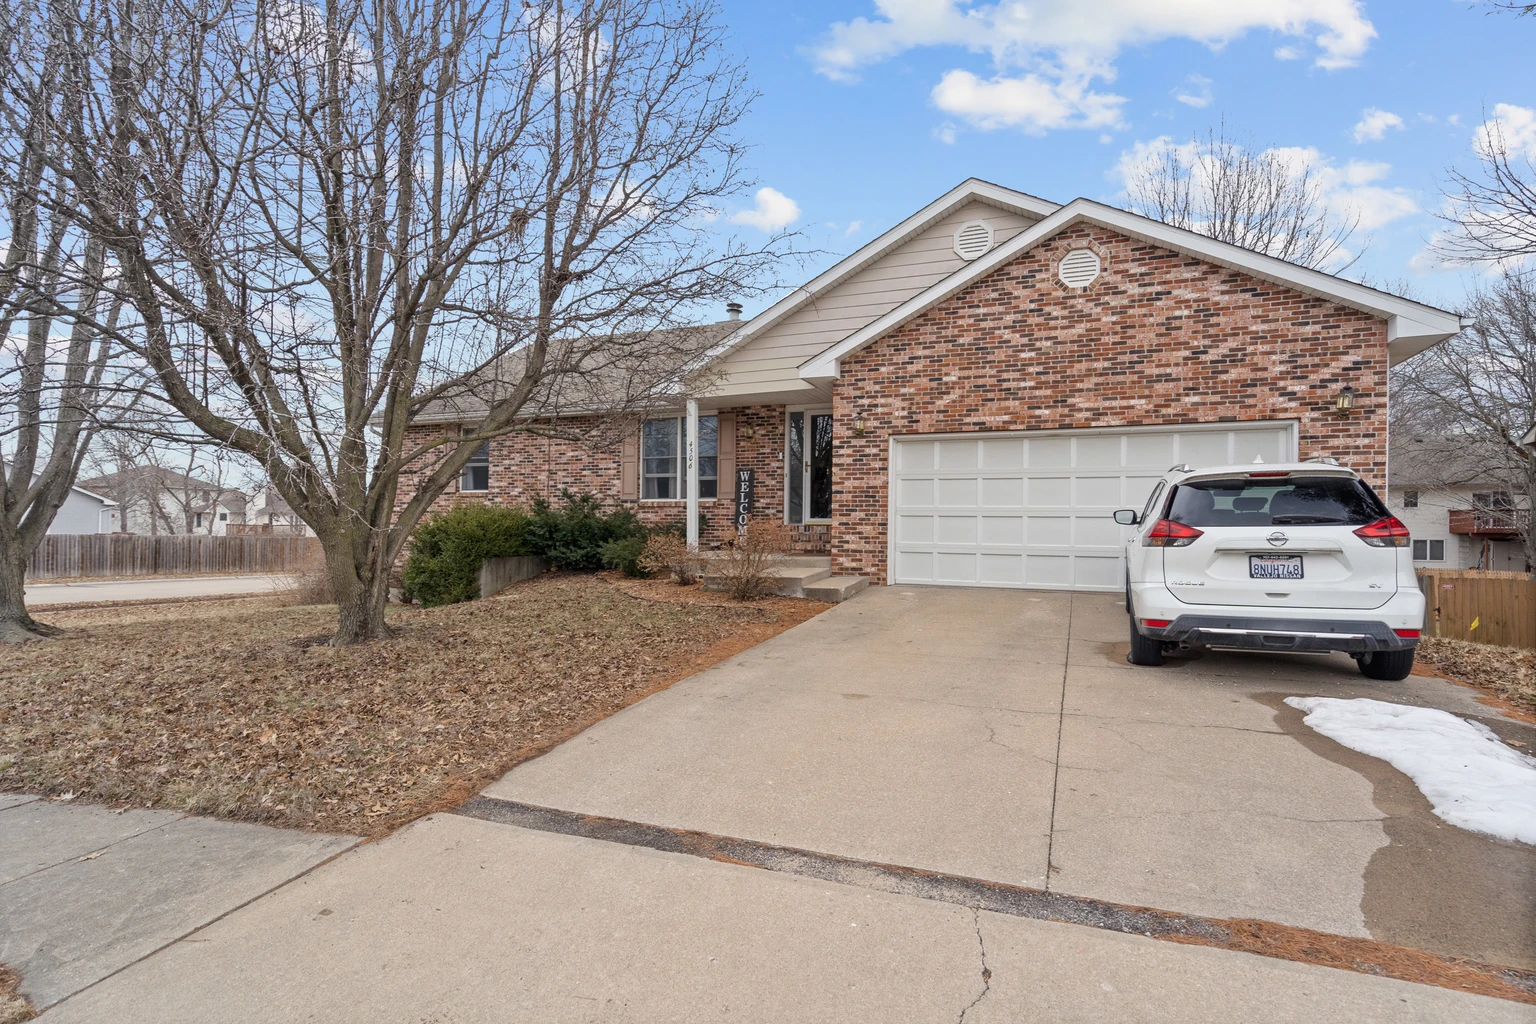
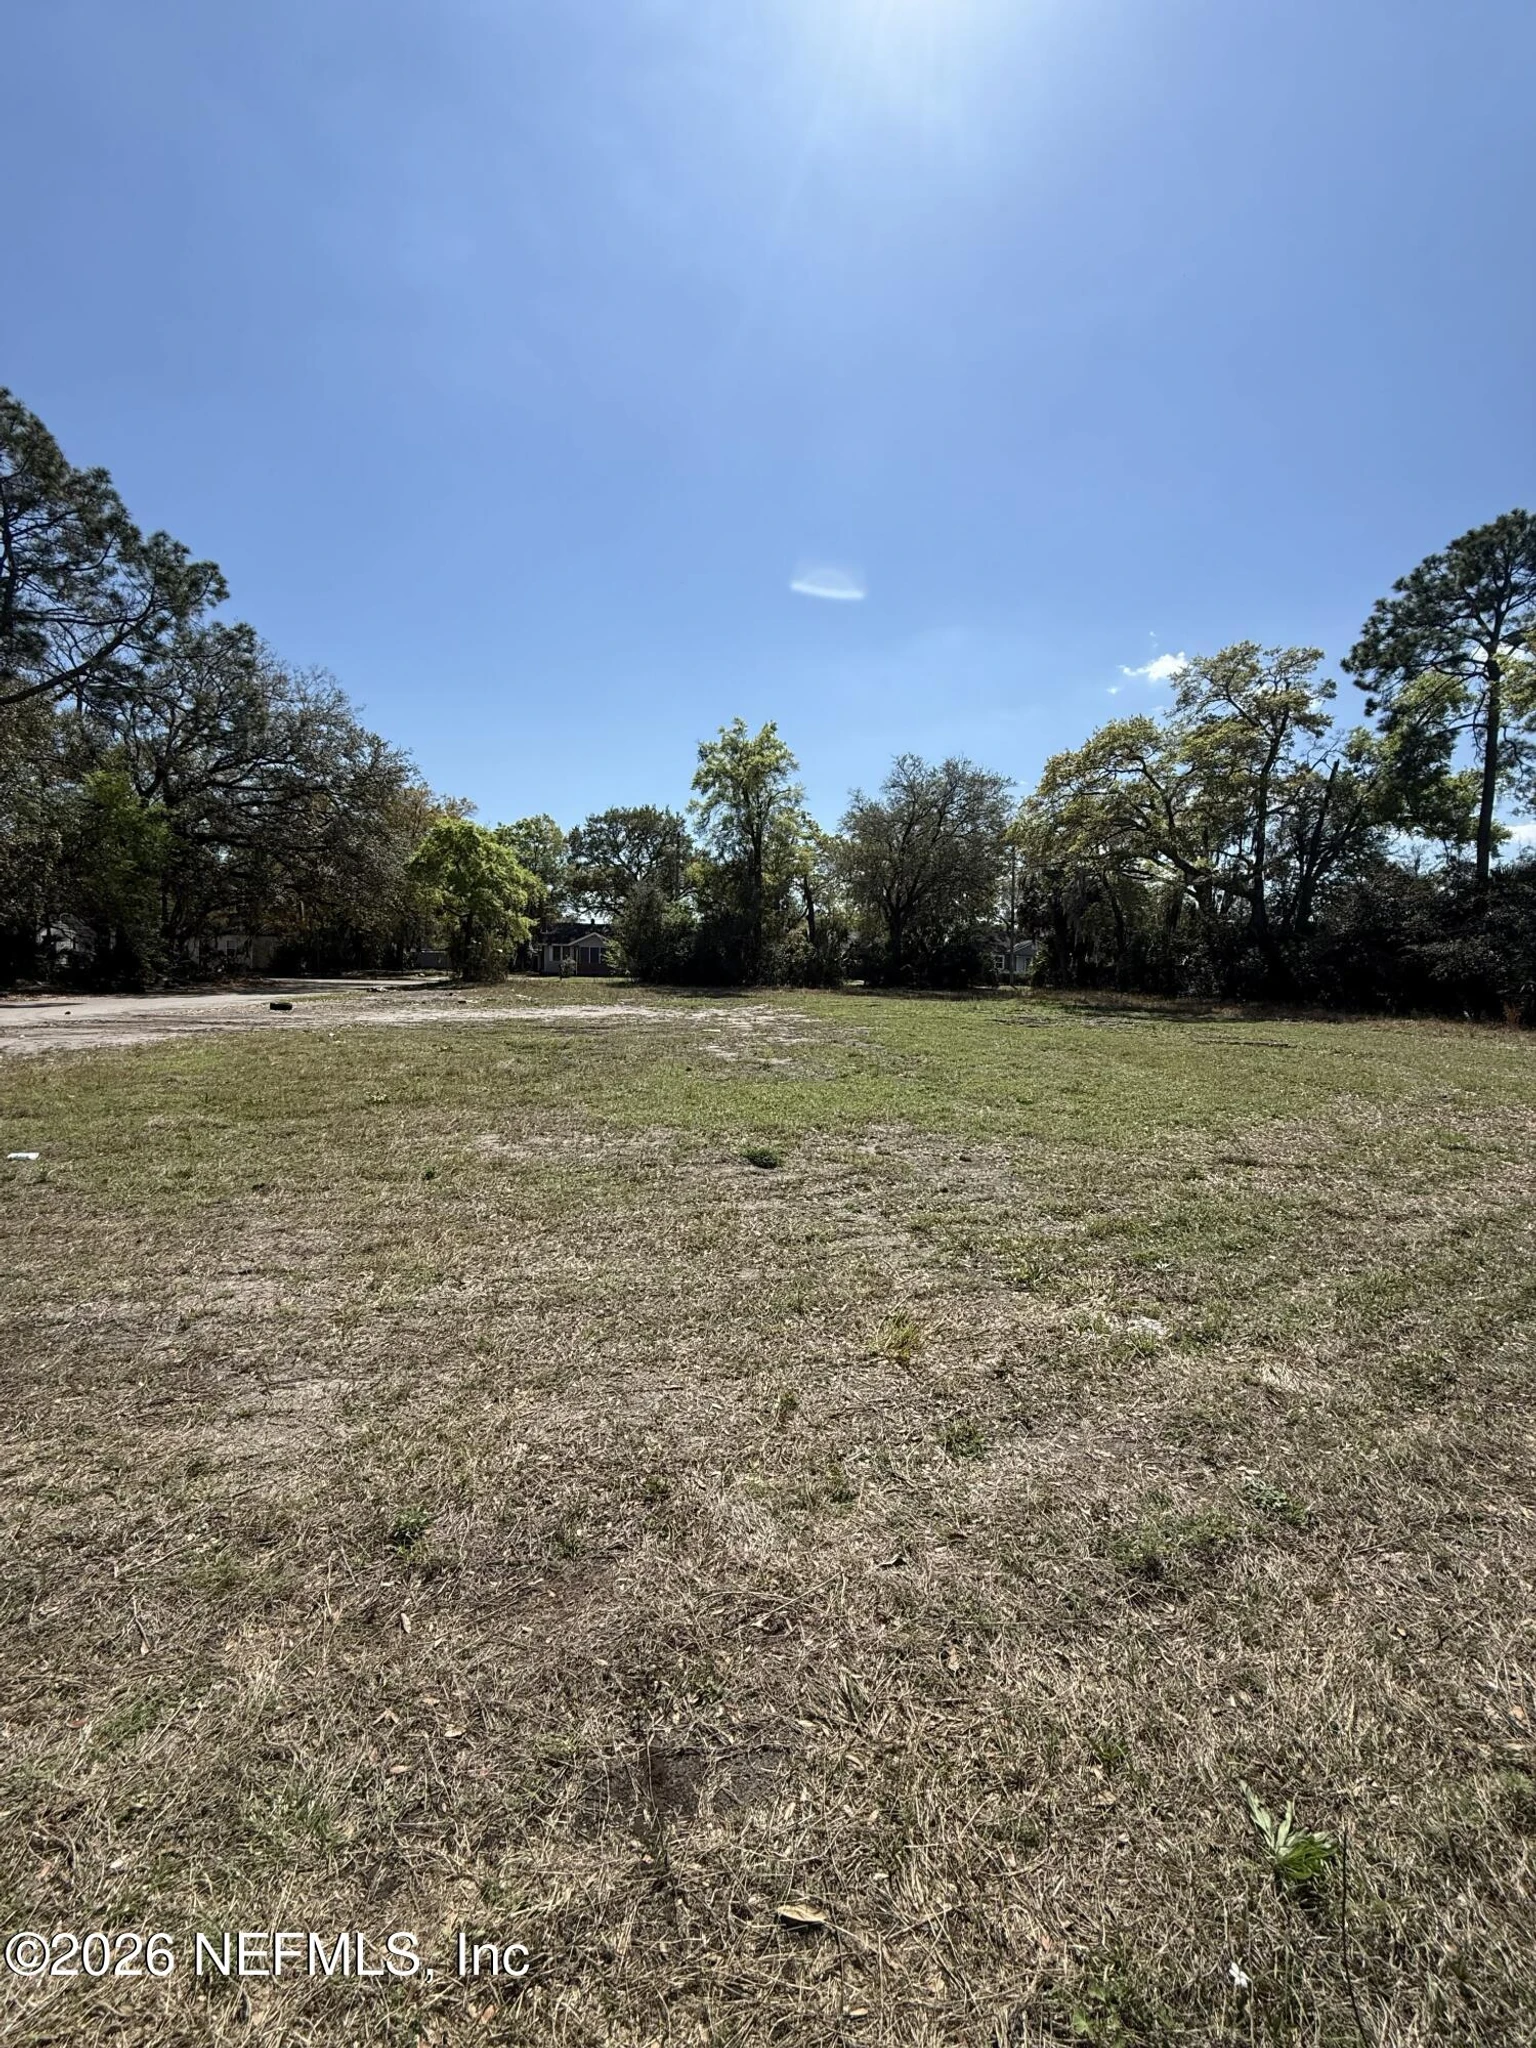
Recently Sold Investment Properties in Chicago, IL
6 previously listed properties in Chicago.


About the Chicago Real Estate Investment Market
Chicago enters 2026 in clear recovery mode after three consecutive years of historically suppressed transaction volume. The Chicago Association of REALTORS' 2026 outlook frames the year as a return to normalcy: mortgage rates have eased from near 7% into the low-6% range, regional employment sits at or near record highs, and new listings are slowly thawing as homeowners who were rate-locked accept current conditions and move on with retirements, relocations, and family changes. The Illinois Realtors forecast pencils Chicago metro closed sales at roughly 80,116 for the year ending October 2026, a 5.1% increase, with home prices projected to rise about 5%, meaningfully outpacing the flat national headline but still well below the post-pandemic frenzy that defined 2021–2022.
On the ground in the city itself, the picture is more nuanced. The Chicago Association of REALTORS pegged the November 2025 median sales price at $360,000, down 0.6% year-over-year, with active inventory at 3,762 homes (down 23.9% YoY) and just two months of supply, still a structurally tight market by national standards. Days on market averaged 57 in November 2025 and 47 in August 2025, materially faster than slower Sun Belt metros. By March 2026, Cook County's Redfin median had climbed to $369,450 (+4.1% YoY), confirming that prices are stabilizing higher even as the city-proper number bounces around month to month. The headline takeaway for Chicago: this is a balanced market with localized pockets of seller power, not a broad price correction.
For investors, Chicago's appeal in 2026 is its rare combination of large-metro liquidity and Midwest-style yields. Citywide multifamily cap rates average around 6.2%, but Class B/C product on the South and West Sides routinely trades at 7.5%–8.5%, with Bronzeville, South Shore, and Kenwood deals printing 7%–8.3% cap rates and 6%–8% gross rental yields. Roughly $18 billion in major development projects are underway across the metro, and the city's INVEST South/West initiative continues to channel public-private capital, including a Bronzeville Lakefront megaproject, into historically under-invested neighborhoods. That mix of tightening supply, recovering demand, and yield-rich submarkets is what separates Chicago from coastal alternatives in 2026.
The risks are real and worth underwriting honestly. Cook County's property tax structure is one of the heaviest in the country, transfer taxes on commercial and larger residential transactions changed materially in recent years, and certain condo segments still face elevated assessments tied to building reserve requirements. None of that has derailed the recovery: Chicago's combination of diversified employment, strong owner equity, and historically low foreclosure rates is anchoring price stability, but it does make precise, neighborhood-level underwriting more important here than in most peer markets.
Key Market Statistics for Chicago
| Median Sale Price | Inventory Level | Avg Days on Market | YoY Price Change |
|---|---|---|---|
| $360,000 | 3,762 | 57 days | -0.6% |
Source: aggregated public real estate data, as of November 2025.
Year-Over-Year Market Comparison
Year-over-year, Chicago's 2025 closed with prices essentially flat at the city level (the November 2025 median of $360,000 was 0.6% below November 2024) but with the metro broadly stable and the suburbs and Cook County overall trending modestly higher. Sales volume in November 2025 fell 11.0% YoY to 1,344 closed transactions, and inventory shrank 23.9% YoY, a counterintuitive squeeze in a year when many other U.S. metros saw inventory rebuild. Days on market actually compressed about 13.6% YoY in November, evidence that the few homes that did list moved quickly. Heading into 2026, Redfin's March 2026 Cook County median of $369,450 (+4.1% YoY) and Realtor.com's April 2026 read of new-listing volume hitting its highest April level since 2022 both point to a Chicago market that has bottomed, is rebuilding inventory off a low base, and is appreciating again, just slowly and unevenly across submarkets.
Trending Neighborhoods in Chicago
- Bronzeville
- Avondale
- Logan Square
- West Loop / Fulton Market
- Pilsen
- Hyde Park
- Kenwood
- South Shore
- Wicker Park
- Humboldt Park
- Bridgeport
In-Demand Property Types in Chicago
- Two-flats and three-flats (small multifamily)
- Single-family homes in transit-rich neighborhoods
- Vintage greystones and rehabbed walk-ups
- New-construction condos near Fulton Market and the West Loop
Recent Market Shifts & Trends
The defining shift in Chicago heading into 2026 is the move from a rate-frozen, low-volume market to a recovering one without the affordability crunch of the Sun Belt. Mortgage rates settling into the low-6% range have unlocked a backlog of move-up buyers and downsizing retirees, lifting metro sales 5.1% in the latest forecast period. New-listing volume hit its highest April level since 2022, but inventory remains structurally tight at roughly 2.0 months of supply citywide, which keeps well-priced homes competitive. At the same time, Chicago's underlying value proposition has improved relative to coastal metros: prices grew slower than wages through 2024–2025, modestly improving affordability, and South Side multifamily continues to deliver yields that simply don't exist in Boston, New York, or LA. The market is no longer "cheap by accident", it's being repriced as institutional and out-of-state capital recognizes the cash-flow story.
Expert Insights
“The 2026 Chicago market is shaping up as a recovery year rather than a boom. Mortgage rates falling from near 7% into the low-6% range is the single biggest unlock, and we expect closed sales in the metro to rise about 5.1% to 80,116 with home prices up roughly 5%. Strong employment and historically low foreclosure rates support price stability, but the recovery will be uneven across micro-markets, neighborhoods near the Loop should remain competitive seller's territory while outer submarkets normalize.”
“Spring 2026 is the most balanced Chicago market we've seen in years. Existing-home sales reached about 282,000 in March, the first year-over-year increase for that month in five years, and homes are selling at roughly a 1.5% discount to list price with about two months to closing. Buyers finally have negotiating room, but well-prepared, correctly priced listings are still moving quickly, particularly in transit-rich North Side neighborhoods.”
“Chicago South Side multifamily is one of the few large-metro stories where the cash-flow math still works in 2026. Class B/C product in submarkets like Bronzeville, South Shore, and Kenwood is trading at 7.5%–8.5% cap rates with gross rental yields in the 6%–8% range. Citywide multifamily averages around 6.2%, but the spread to South and West Side product is wide enough that yield-focused investors are actively rotating in.”
Key Takeaways
For investors evaluating Chicago in 2026, three actionable points stand out. First, this is a stock-pickers' market rather than a rising-tide market, citywide medians are roughly flat YoY while Cook County and select neighborhoods are appreciating 4%–5%, so submarket selection matters more than market timing. Second, Chicago is one of the few major U.S. metros where positive cash flow on small multifamily is still mathematically achievable at scale; Bronzeville, Avondale, Pilsen, and the South Shore corridor are where the yield-and-appreciation story is strongest. Third, underwrite Cook County property taxes and assessment cycles carefully, they are the biggest single drag on net operating income and the most common reason out-of-state investors get the math wrong. With rates trending lower, inventory normalizing off a low base, and $18B+ in development capital flowing into the city, Chicago in 2026 looks more like a quietly rebuilding market than a struggling one.
Frequently Asked Questions About Chicago Real Estate
Is Chicago, IL a good market for fractional real estate investing?
For investors evaluating Chicago in 2026, three actionable points stand out. First, this is a stock-pickers' market rather than a rising-tide market, citywide medians are roughly flat YoY while Cook County and select neighborhoods are appreciating 4%–5%, so submarket selection matters more than market timing. Second, Chicago is one of the few major U.S. metros where positive cash flow on small multifamily is still mathematically achievable at scale; Bronzeville, Avondale, Pilsen, and the South Shore corridor are where the yield-and-appreciation story is strongest. Third, underwrite Cook County property taxes and assessment cycles carefully, they are the biggest single drag on net operating income and the most common reason out-of-state investors get the math wrong. With rates trending lower, inventory normalizing off a low base, and $18B+ in development capital flowing into the city, Chicago in 2026 looks more like a quietly rebuilding market than a struggling one.
What is the median sale price in Chicago, IL?
The median sale price in Chicago, IL is approximately $360,000 as of November 2025.
What are trending neighborhoods in Chicago, IL?
Trending neighborhoods in Chicago, IL include Bronzeville, Avondale, Logan Square, West Loop / Fulton Market, Pilsen, Hyde Park.
What property types are in demand for investment properties in Chicago, IL?
In-demand investment property types in Chicago, IL include Two-flats and three-flats (small multifamily), Single-family homes in transit-rich neighborhoods, Vintage greystones and rehabbed walk-ups, New-construction condos near Fulton Market and the West Loop.
Data Sources
- Chicago Association of REALTORS, November 2025 Market Snapshot
- Chicago Association of REALTORS, 2026 Residential Real Estate Outlook
- Illinois Realtors, November 2025 Forecast
- Chicago Agent Magazine, Spring 2026 Market Update
- Redfin, Cook County Housing Market
- Zillow: Chicago, IL Home Values
- Realtor.com, April 2026 Monthly Housing Report
- CRE Consult, Chicago Multifamily Market 2025 Update
- Essex Realty Group, South Side Multifamily Growth 2025
- National Association of Realtors (NAR)
Other Investment Property Markets Near Chicago
Explore fractional real estate investment properties in other U.S. markets on Lofty.
- Investment Properties in Acton, CA
- Investment Properties in Akron, OH
- Investment Properties in Albany, NY
- Investment Properties in Albuquerque, NM
- Investment Properties in Atlanta, GA
- Investment Properties in Atlantic City, NJ
- Investment Properties in Austin, TX
- Investment Properties in Avon Park, FL
- Investment Properties in Baltimore, MD
- Investment Properties in Berkeley, CA
- Investment Properties in Birmingham, AL
- Investment Properties in Black Creek, NY