'/%3e%3cpath%20d='M110.5%2074.84L61.56%20113.3V150.04H0V87.4L110.5%200V74.84Z'%20fill='url(%23paint1_linear_1102_1766)'/%3e%3cpath%20d='M159.44%20150.04L159.44%20205.81H159.2L110.5%20166.53L61.8001%20205.81H61.5601L61.56%20150.04L110.5%20110.57L159.44%20150.04Z'%20fill='url(%23paint2_linear_1102_1766)'/%3e%3cpath%20d='M110.5%20110.57V166.53L61.8001%20205.81H61.5601L61.56%20150.04L110.5%20110.57Z'%20fill='url(%23paint3_linear_1102_1766)'/%3e%3cpath%20d='M159.44%20206H61.5601L61.8001%20205.81L110.5%20166.53L159.2%20205.81L159.44%20206Z'%20fill='url(%23paint4_linear_1102_1766)'/%3e%3cdefs%3e%3clinearGradient%20id='paint0_linear_1102_1766'%20x1='166'%20y1='-19.908'%20x2='145.641'%20y2='227.731'%20gradientUnits='userSpaceOnUse'%3e%3cstop%20stop-color='%23B5AAFF'/%3e%3cstop%20offset='0.723958'%20stop-color='%238977FF'/%3e%3c/linearGradient%3e%3clinearGradient%20id='paint1_linear_1102_1766'%20x1='64'%20y1='15.7891'%20x2='172.309'%20y2='257.652'%20gradientUnits='userSpaceOnUse'%3e%3cstop%20stop-color='%239383FF'/%3e%3cstop%20offset='0.75'%20stop-color='%234D3FED'/%3e%3c/linearGradient%3e%3clinearGradient%20id='paint2_linear_1102_1766'%20x1='171.462'%20y1='36.6188'%20x2='8.598'%20y2='270.272'%20gradientUnits='userSpaceOnUse'%3e%3cstop%20offset='0.229167'%20stop-color='%23B5AAFF'/%3e%3cstop%20offset='0.994792'%20stop-color='%238977FF'/%3e%3c/linearGradient%3e%3clinearGradient%20id='paint3_linear_1102_1766'%20x1='55.7219'%20y1='-31.3876'%20x2='76.8187'%20y2='349.172'%20gradientUnits='userSpaceOnUse'%3e%3cstop%20offset='0.307292'%20stop-color='%239383FF'/%3e%3cstop%20offset='0.854167'%20stop-color='%234D3FED'/%3e%3c/linearGradient%3e%3clinearGradient%20id='paint4_linear_1102_1766'%20x1='110'%20y1='271'%20x2='76.5255'%20y2='202.314'%20gradientUnits='userSpaceOnUse'%3e%3cstop%20stop-color='%23B5AAFF'/%3e%3cstop%20offset='0.90625'%20stop-color='%238977FF'/%3e%3c/linearGradient%3e%3c/defs%3e%3c/svg%3e)
'/%3e%3cpath%20d='M110.5%2074.84L61.56%20113.3V150.04H0V87.4L110.5%200V74.84Z'%20fill='url(%23paint1_linear_1102_1752)'/%3e%3cpath%20d='M159.44%20150.04L159.44%20205.81H159.2L110.5%20166.53L61.8001%20205.81H61.5601L61.56%20150.04L110.5%20110.57L159.44%20150.04Z'%20fill='url(%23paint2_linear_1102_1752)'/%3e%3cpath%20d='M110.5%20110.57V166.53L61.8001%20205.81H61.5601L61.56%20150.04L110.5%20110.57Z'%20fill='url(%23paint3_linear_1102_1752)'/%3e%3cpath%20d='M159.44%20206H61.5601L61.8001%20205.81L110.5%20166.53L159.2%20205.81L159.44%20206Z'%20fill='url(%23paint4_linear_1102_1752)'/%3e%3cdefs%3e%3clinearGradient%20id='paint0_linear_1102_1752'%20x1='166'%20y1='-19.908'%20x2='145.641'%20y2='227.731'%20gradientUnits='userSpaceOnUse'%3e%3cstop%20stop-color='%23B5AAFF'/%3e%3cstop%20offset='0.723958'%20stop-color='%238977FF'/%3e%3c/linearGradient%3e%3clinearGradient%20id='paint1_linear_1102_1752'%20x1='64'%20y1='15.7891'%20x2='172.309'%20y2='257.652'%20gradientUnits='userSpaceOnUse'%3e%3cstop%20stop-color='%239383FF'/%3e%3cstop%20offset='0.75'%20stop-color='%234D3FED'/%3e%3c/linearGradient%3e%3clinearGradient%20id='paint2_linear_1102_1752'%20x1='171.462'%20y1='36.6188'%20x2='8.598'%20y2='270.272'%20gradientUnits='userSpaceOnUse'%3e%3cstop%20offset='0.229167'%20stop-color='%23B5AAFF'/%3e%3cstop%20offset='0.994792'%20stop-color='%238977FF'/%3e%3c/linearGradient%3e%3clinearGradient%20id='paint3_linear_1102_1752'%20x1='55.7219'%20y1='-31.3876'%20x2='76.8187'%20y2='349.172'%20gradientUnits='userSpaceOnUse'%3e%3cstop%20offset='0.307292'%20stop-color='%239383FF'/%3e%3cstop%20offset='0.854167'%20stop-color='%234D3FED'/%3e%3c/linearGradient%3e%3clinearGradient%20id='paint4_linear_1102_1752'%20x1='110'%20y1='271'%20x2='76.5255'%20y2='202.314'%20gradientUnits='userSpaceOnUse'%3e%3cstop%20stop-color='%23B5AAFF'/%3e%3cstop%20offset='0.90625'%20stop-color='%238977FF'/%3e%3c/linearGradient%3e%3c/defs%3e%3c/svg%3e)
Investment Properties in Cleveland, OH
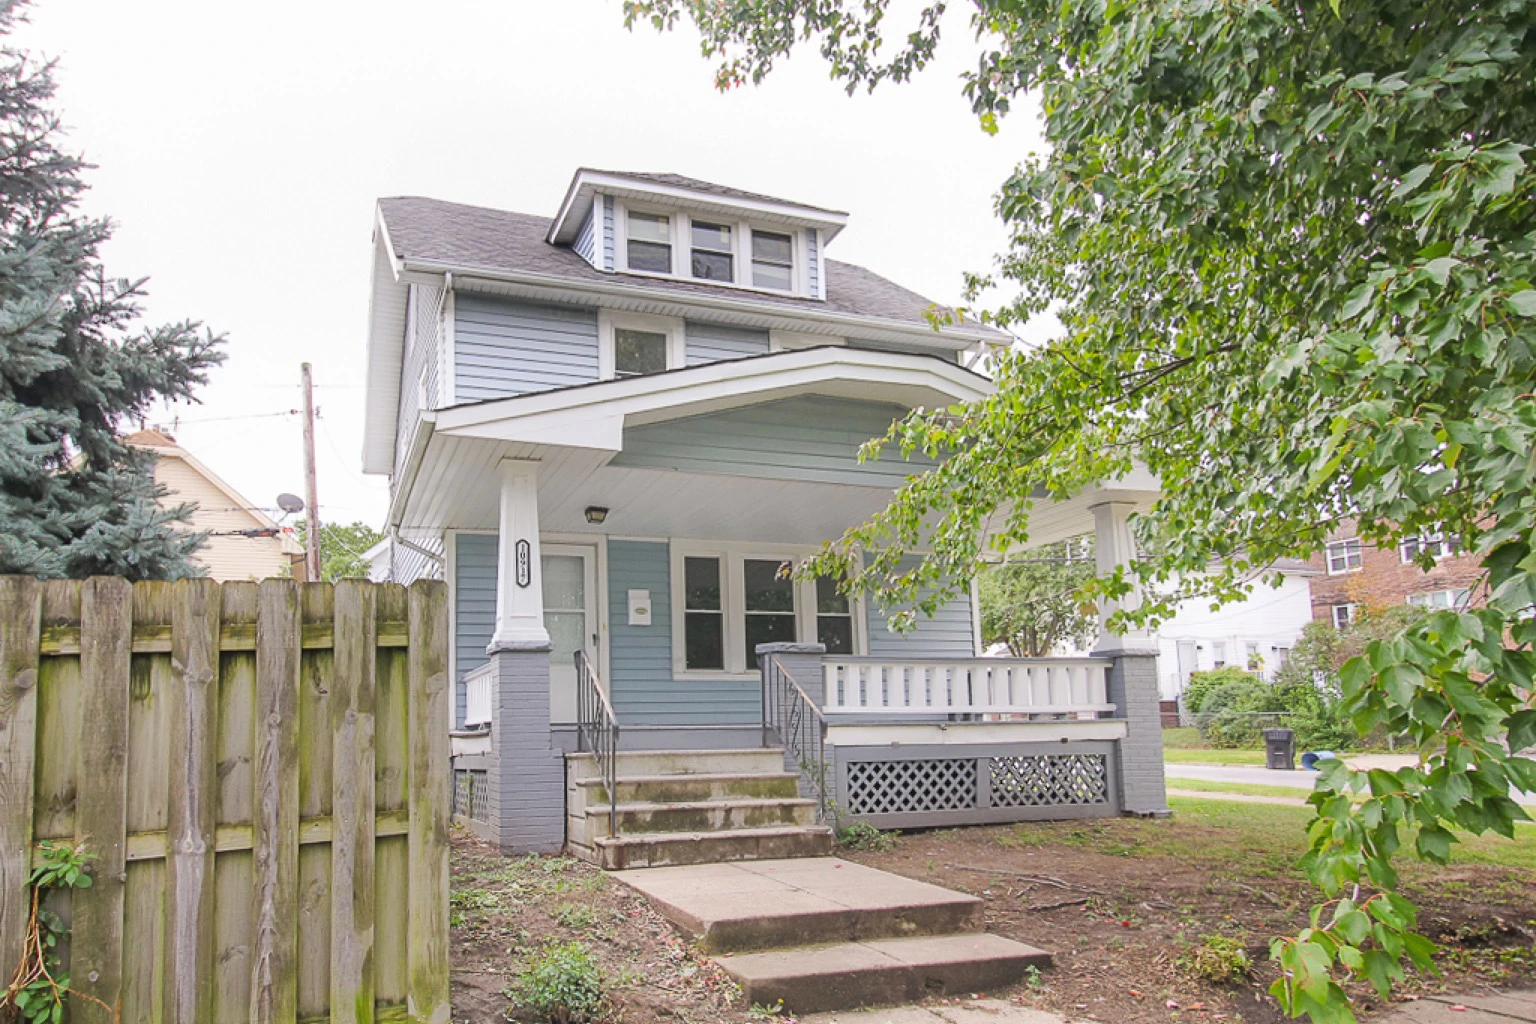
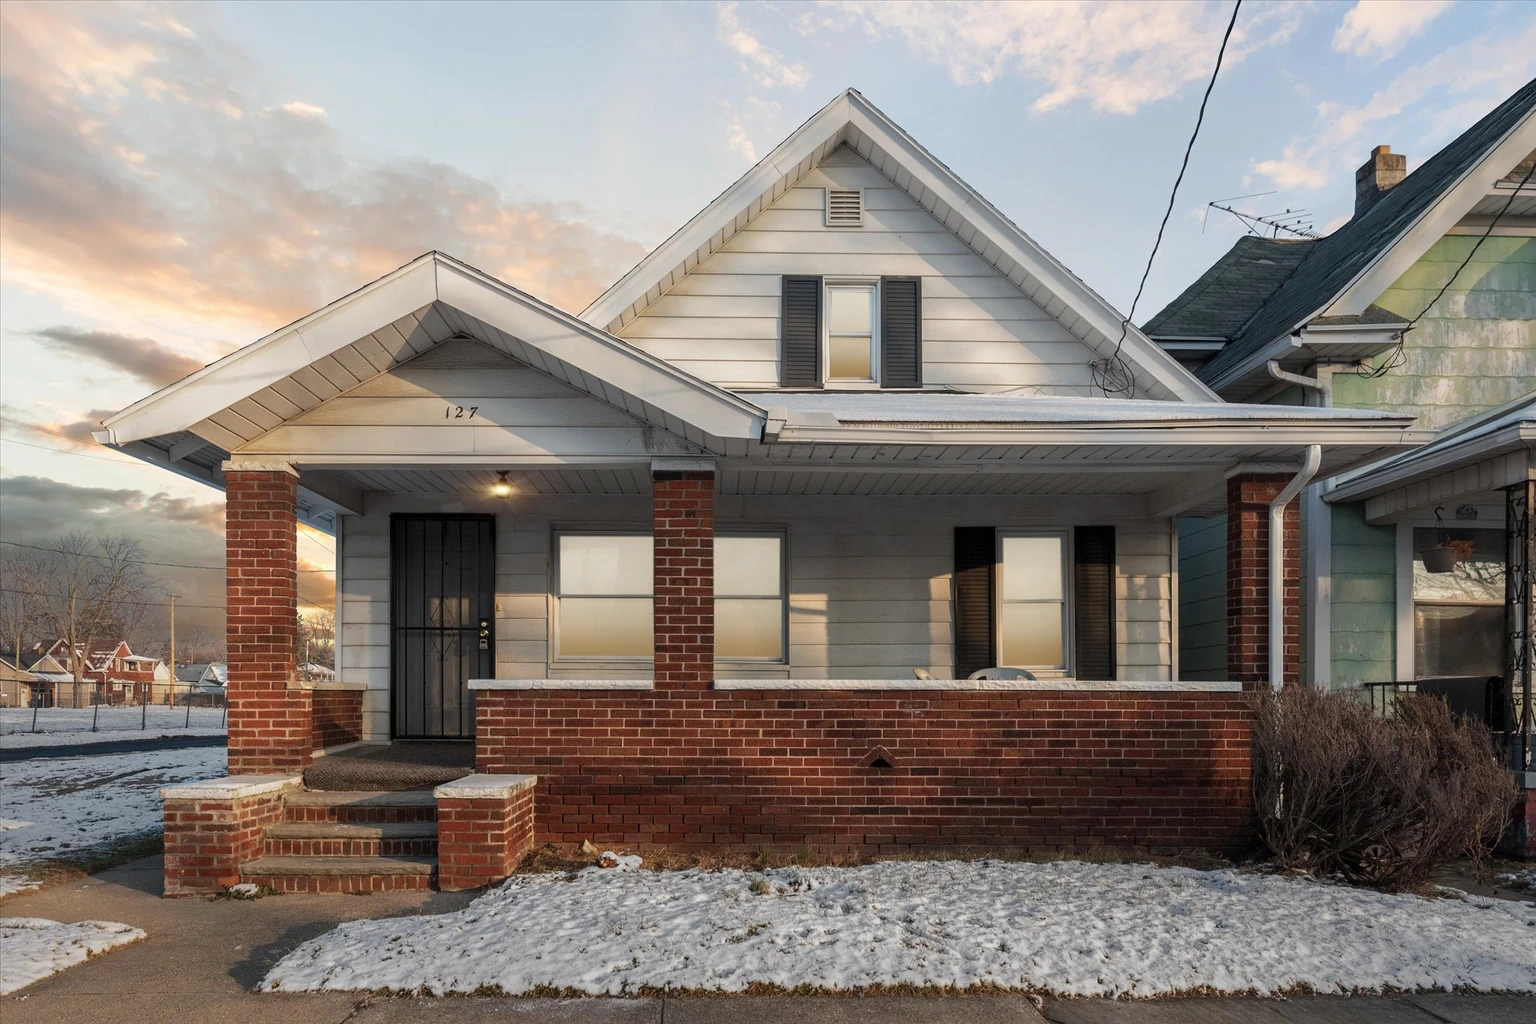
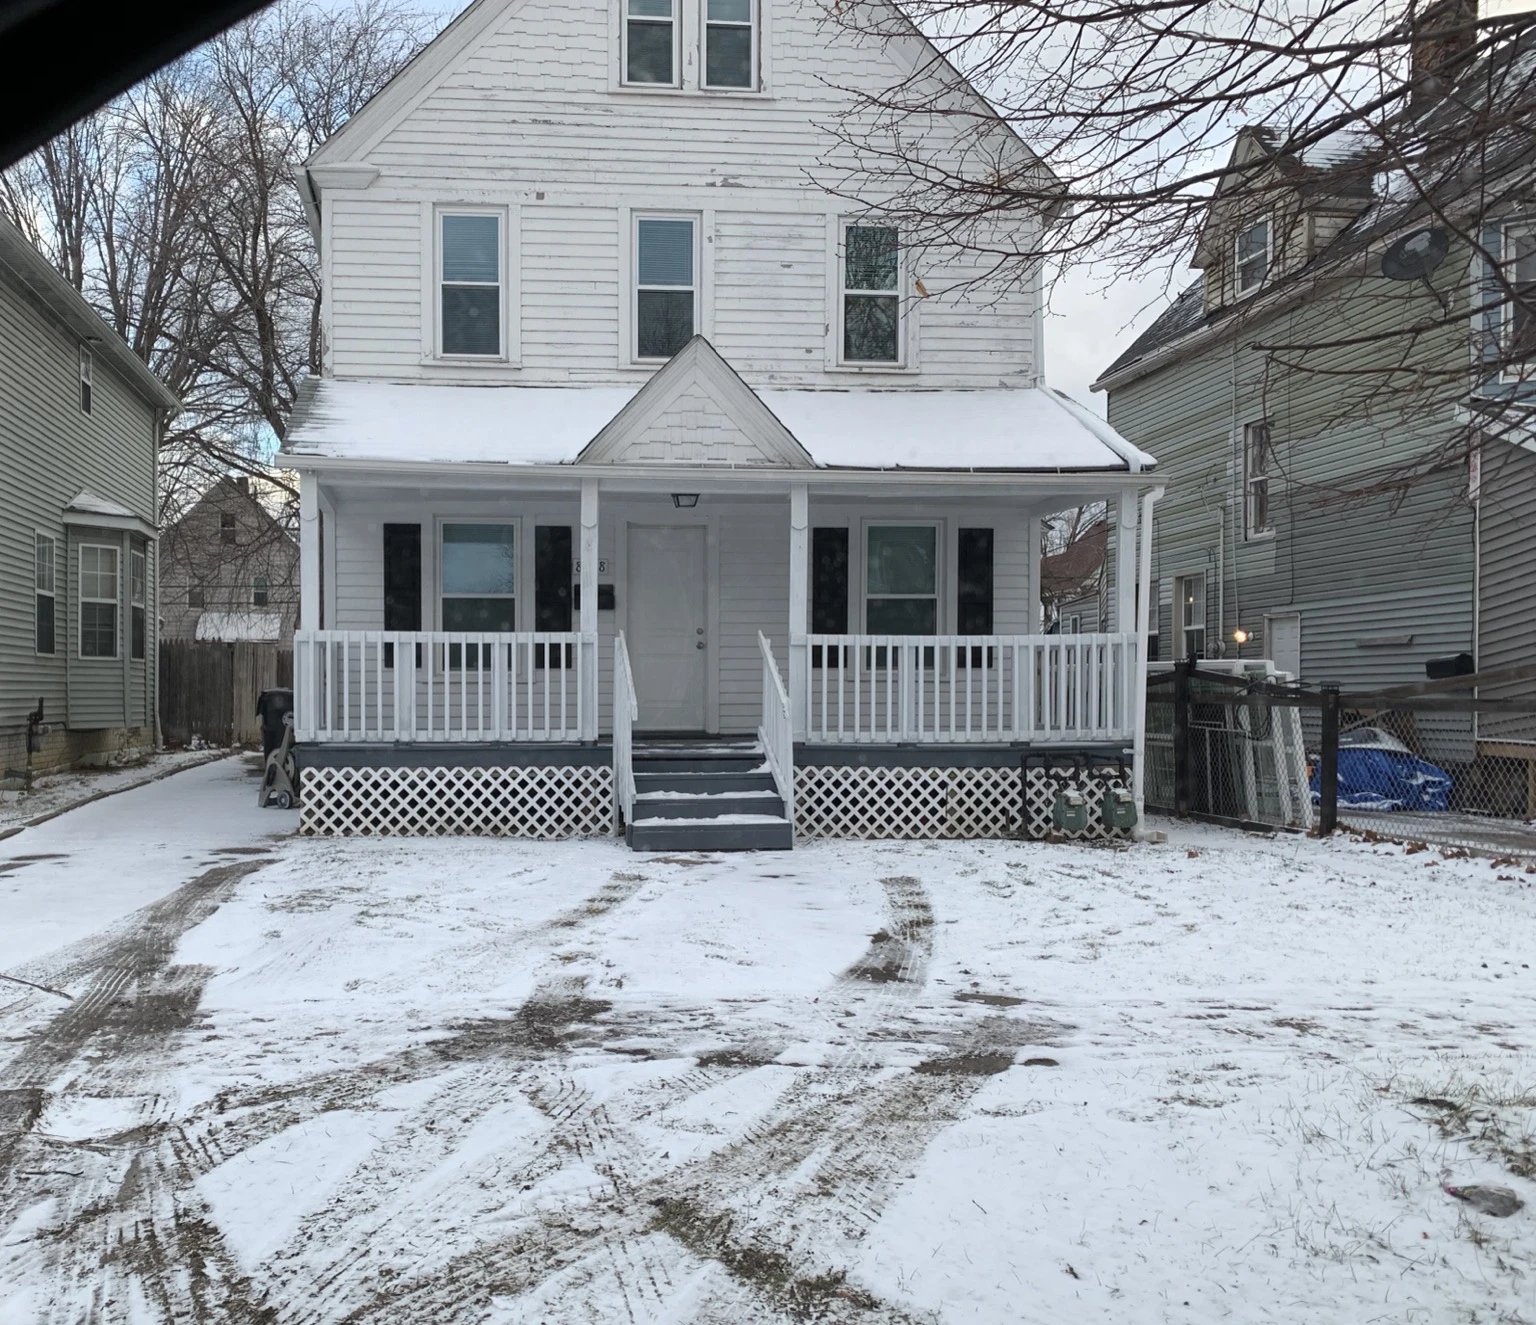
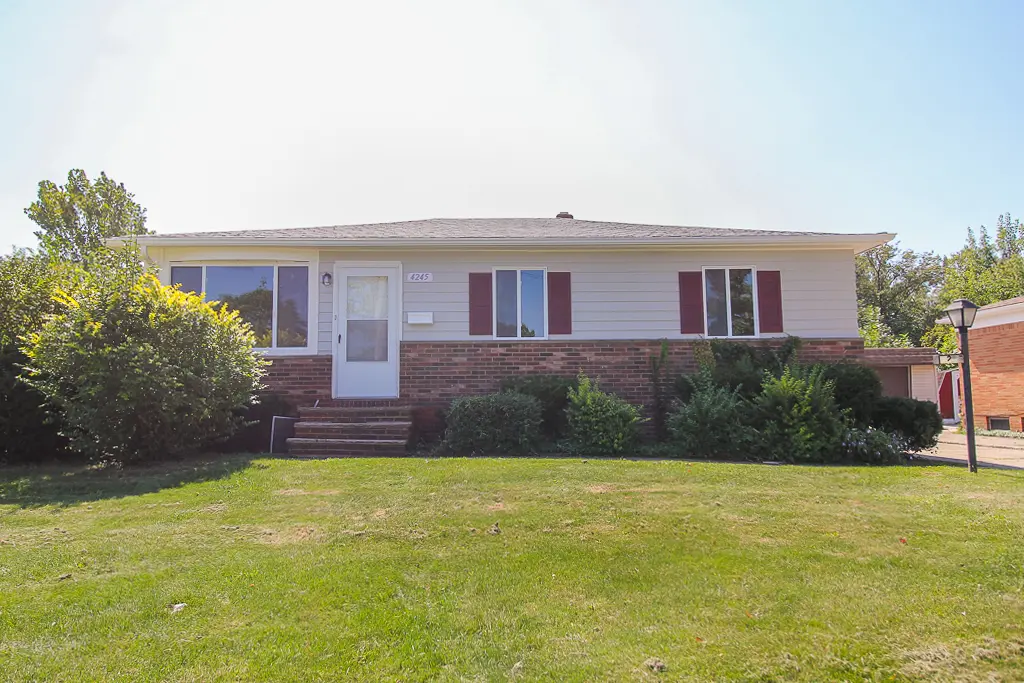
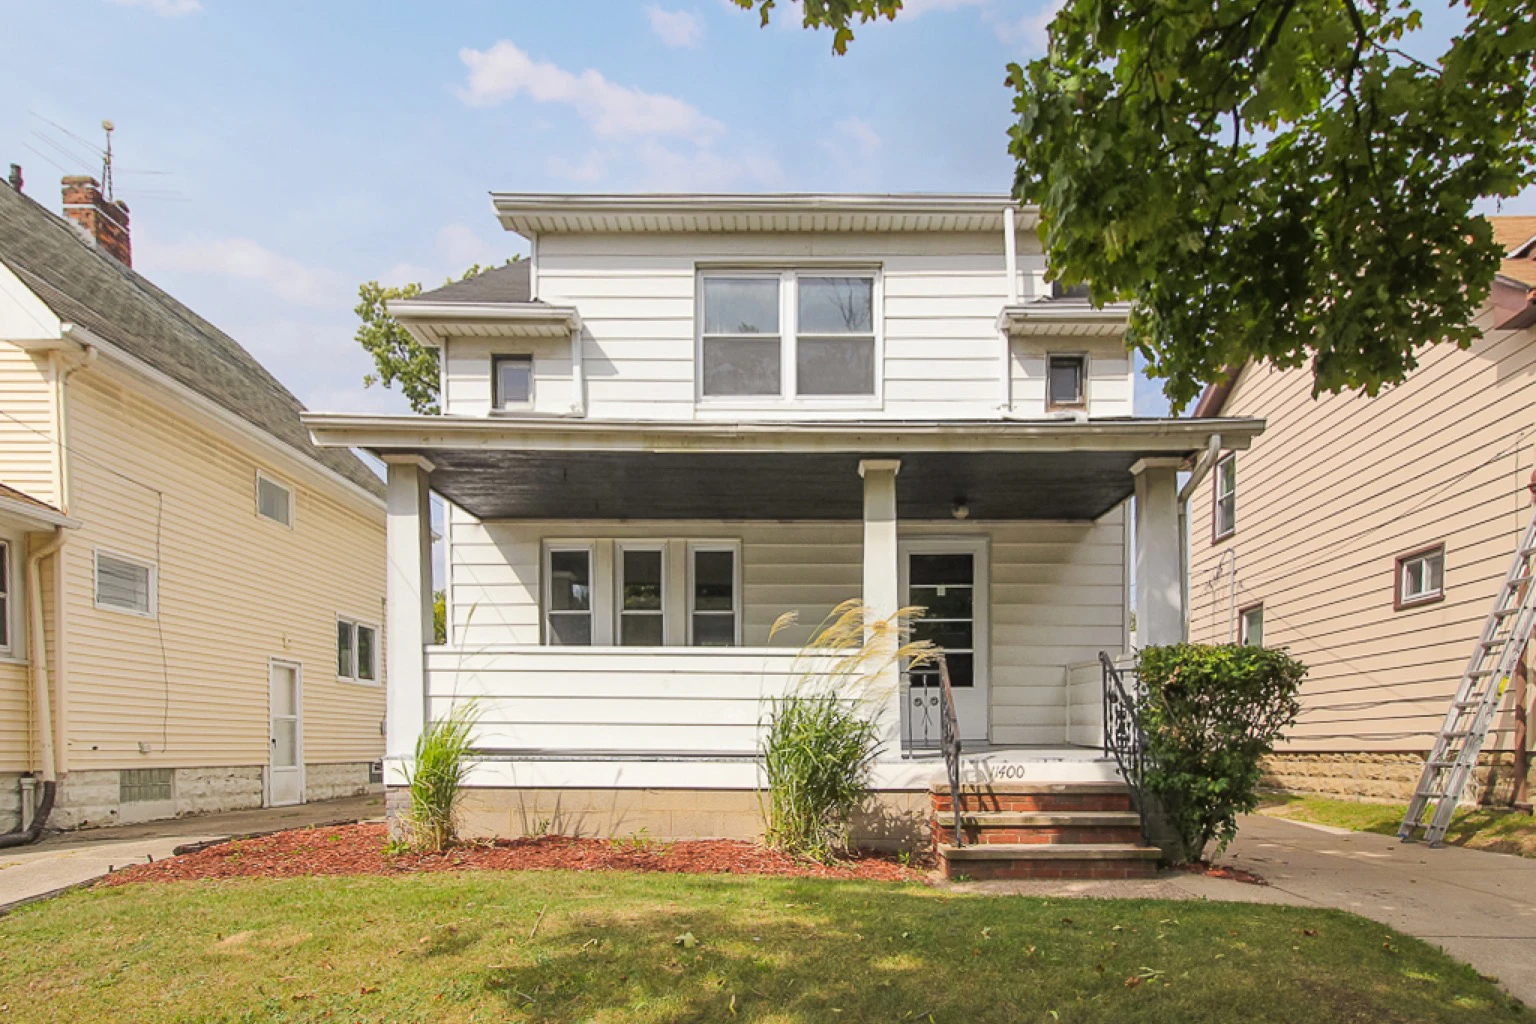
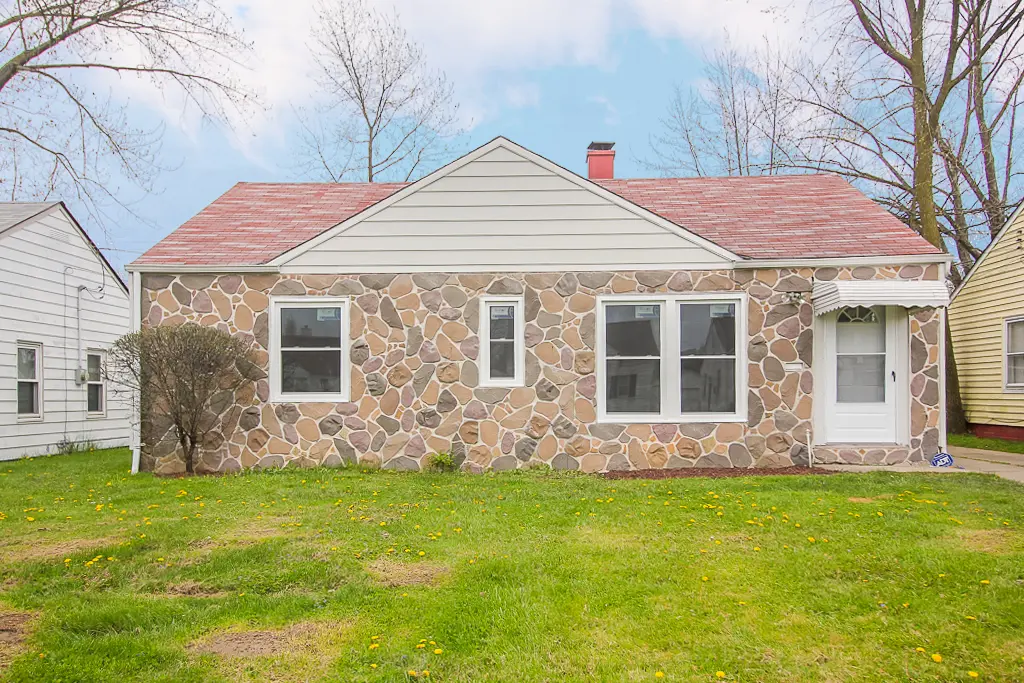
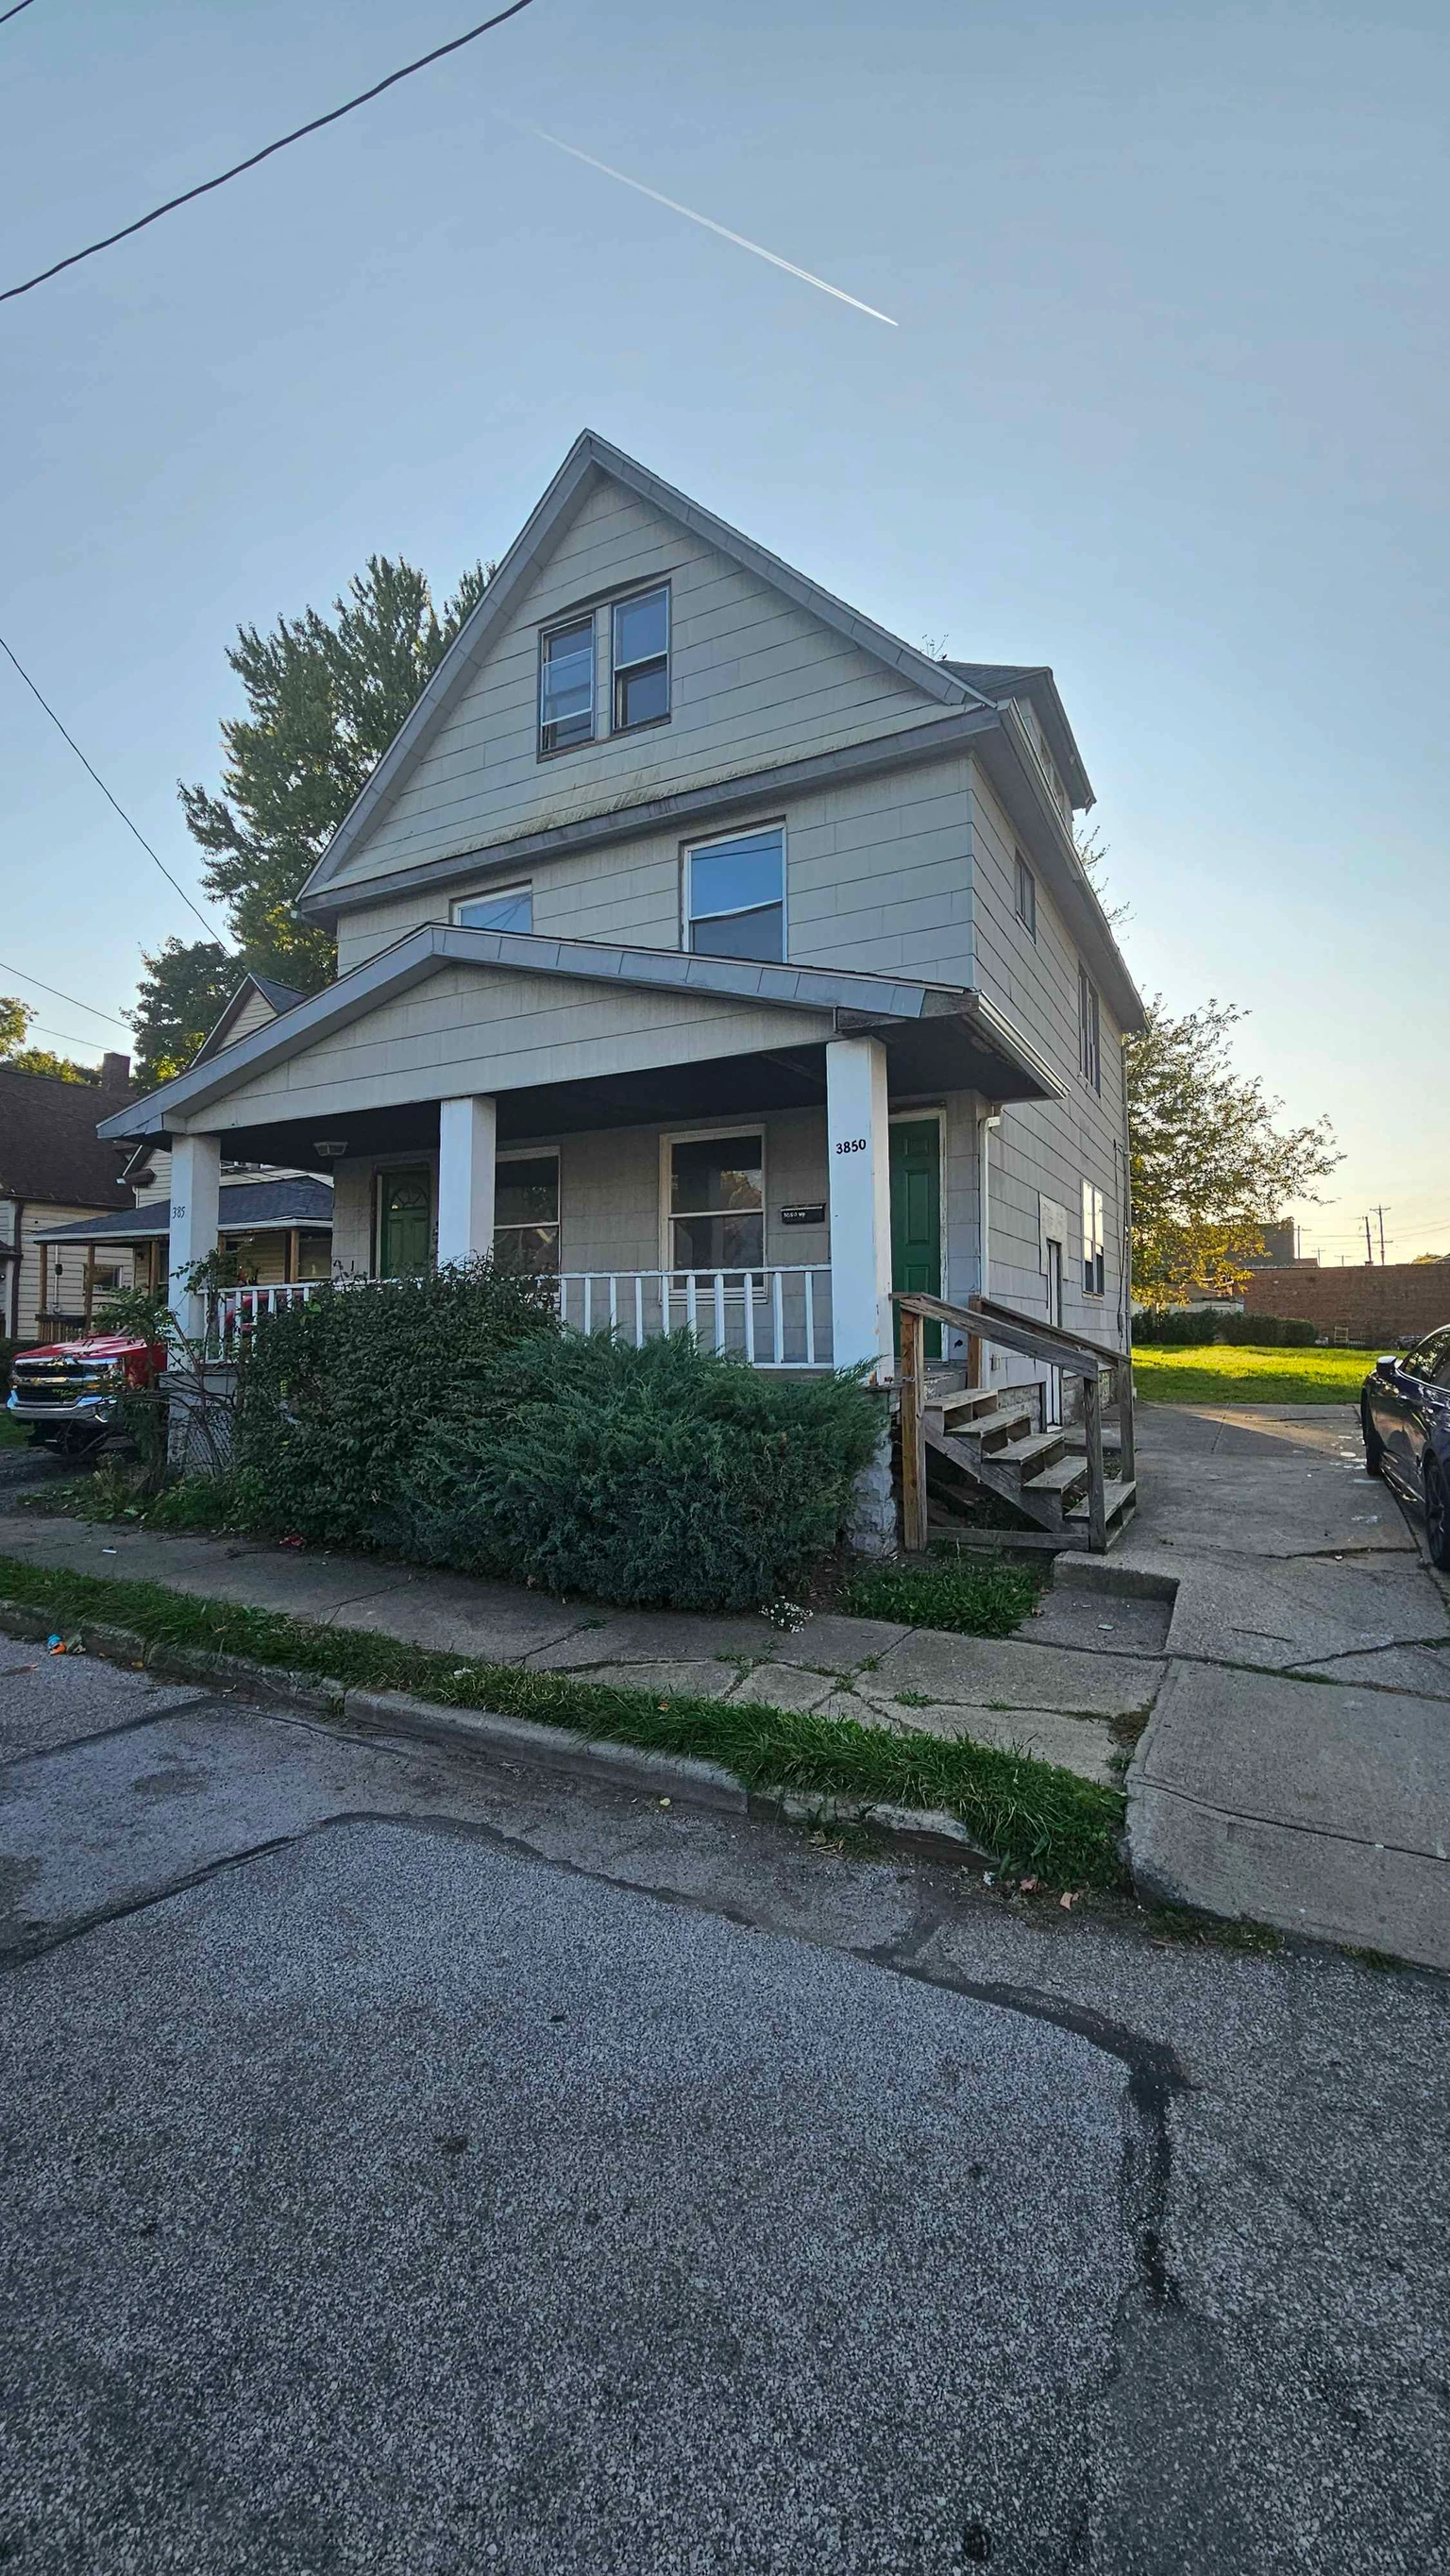
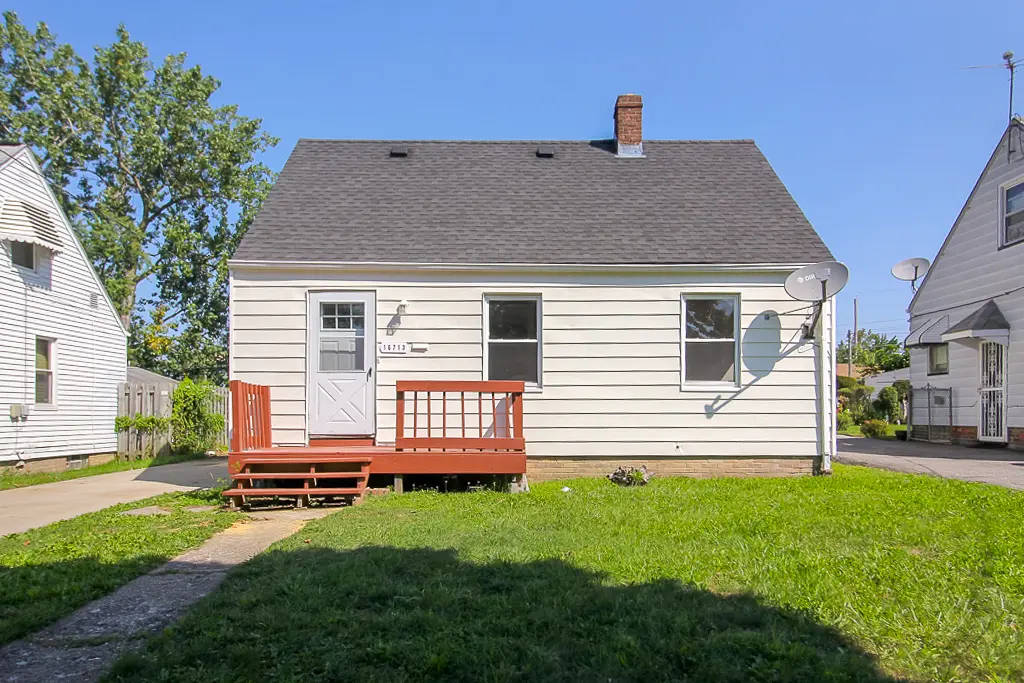
8 fractional real estate investment properties available now in Cleveland.
Available investment properties in Cleveland, OH
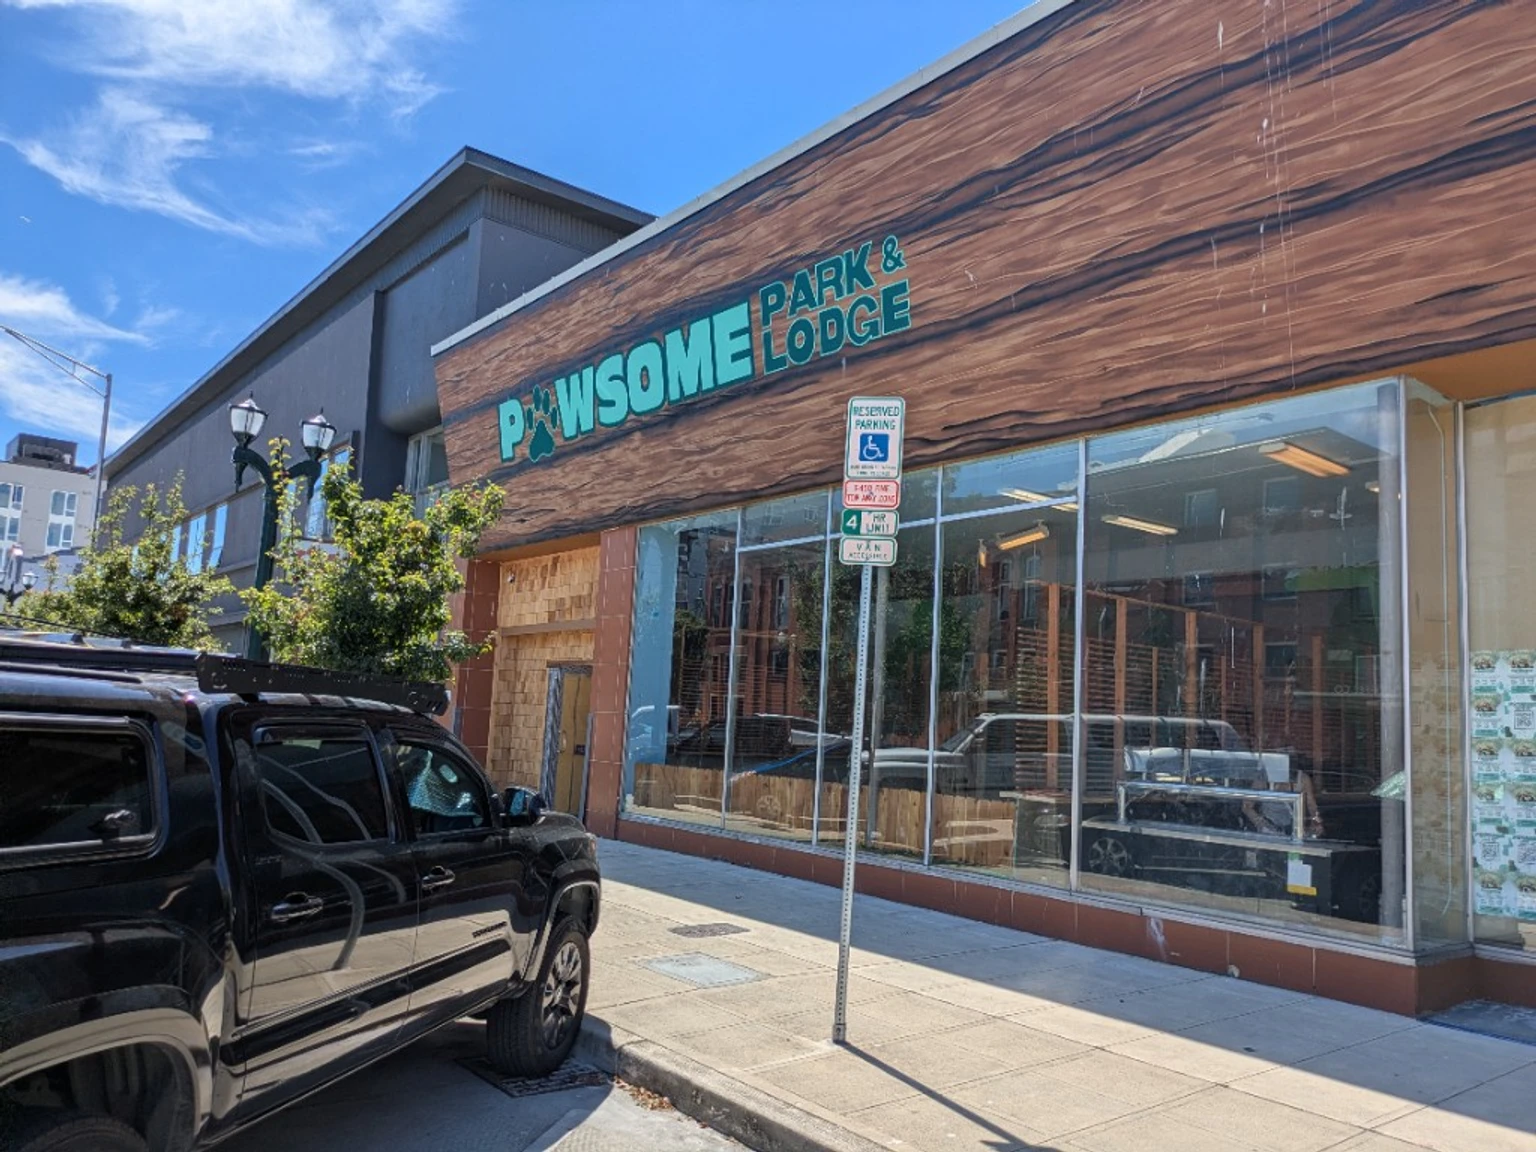
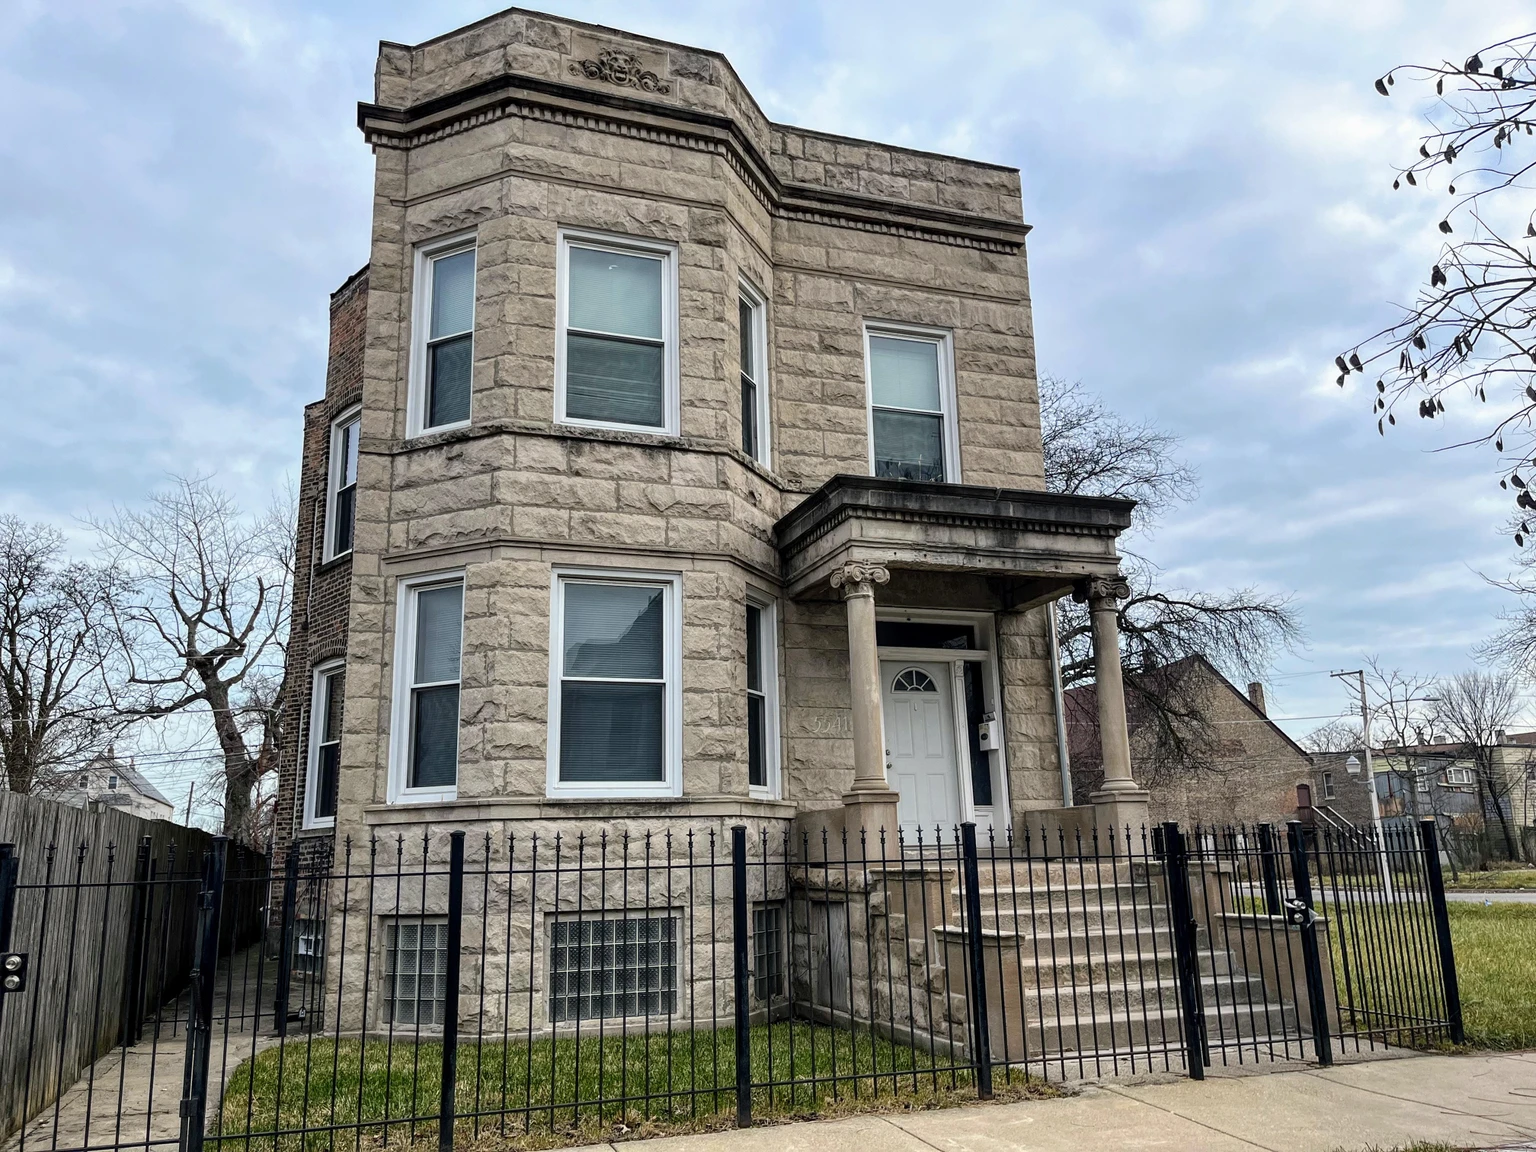
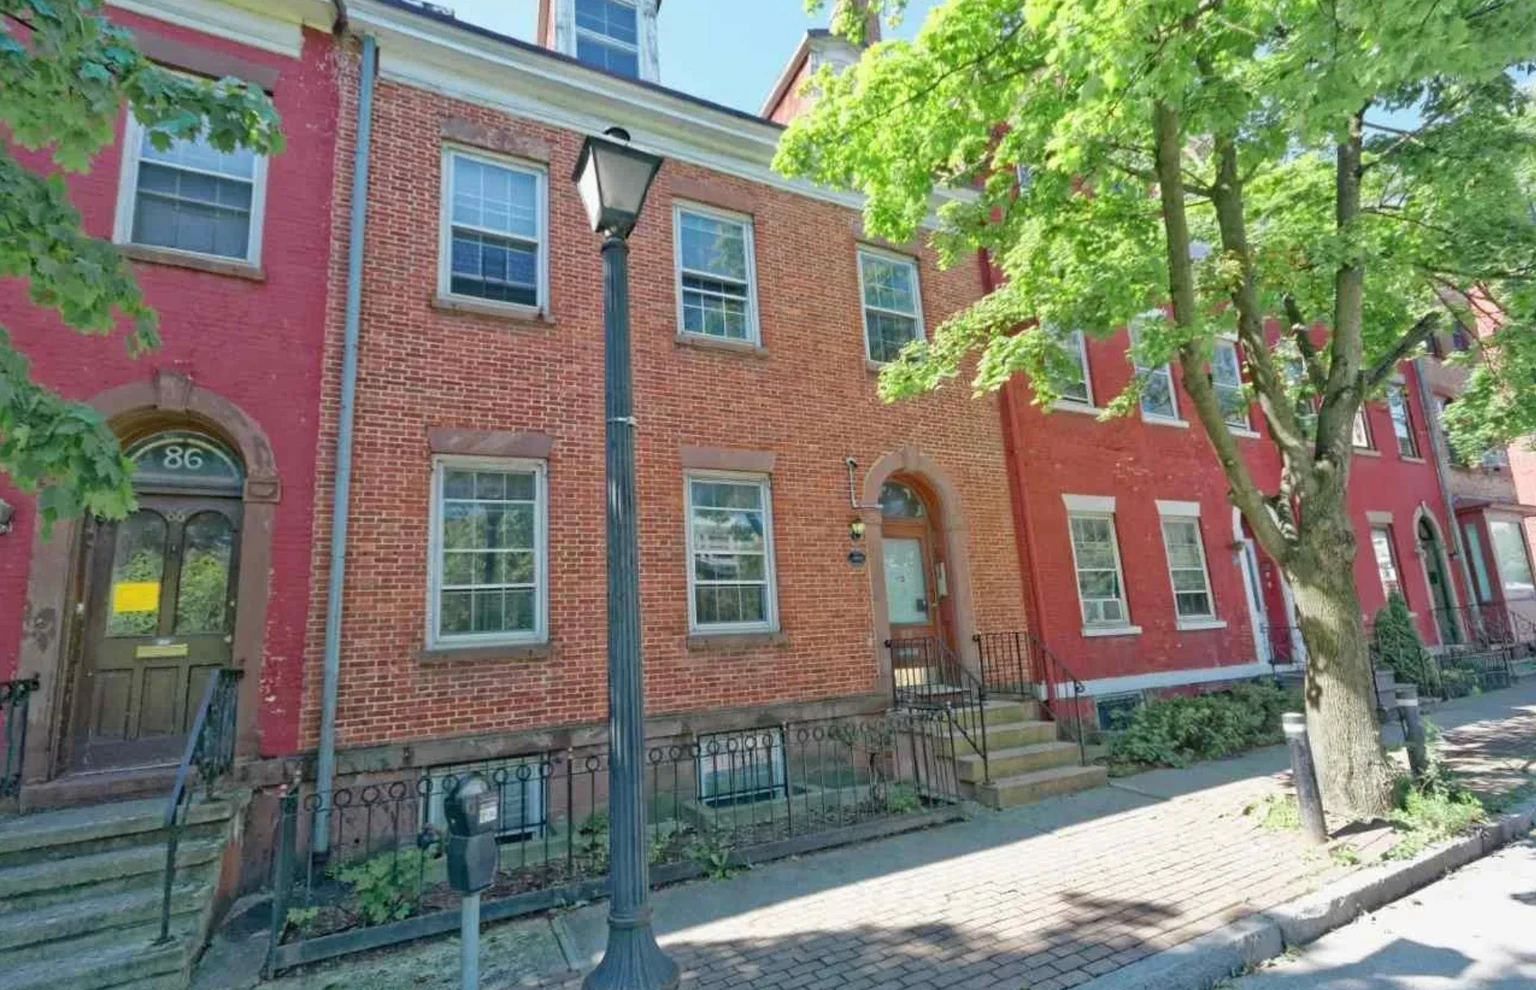
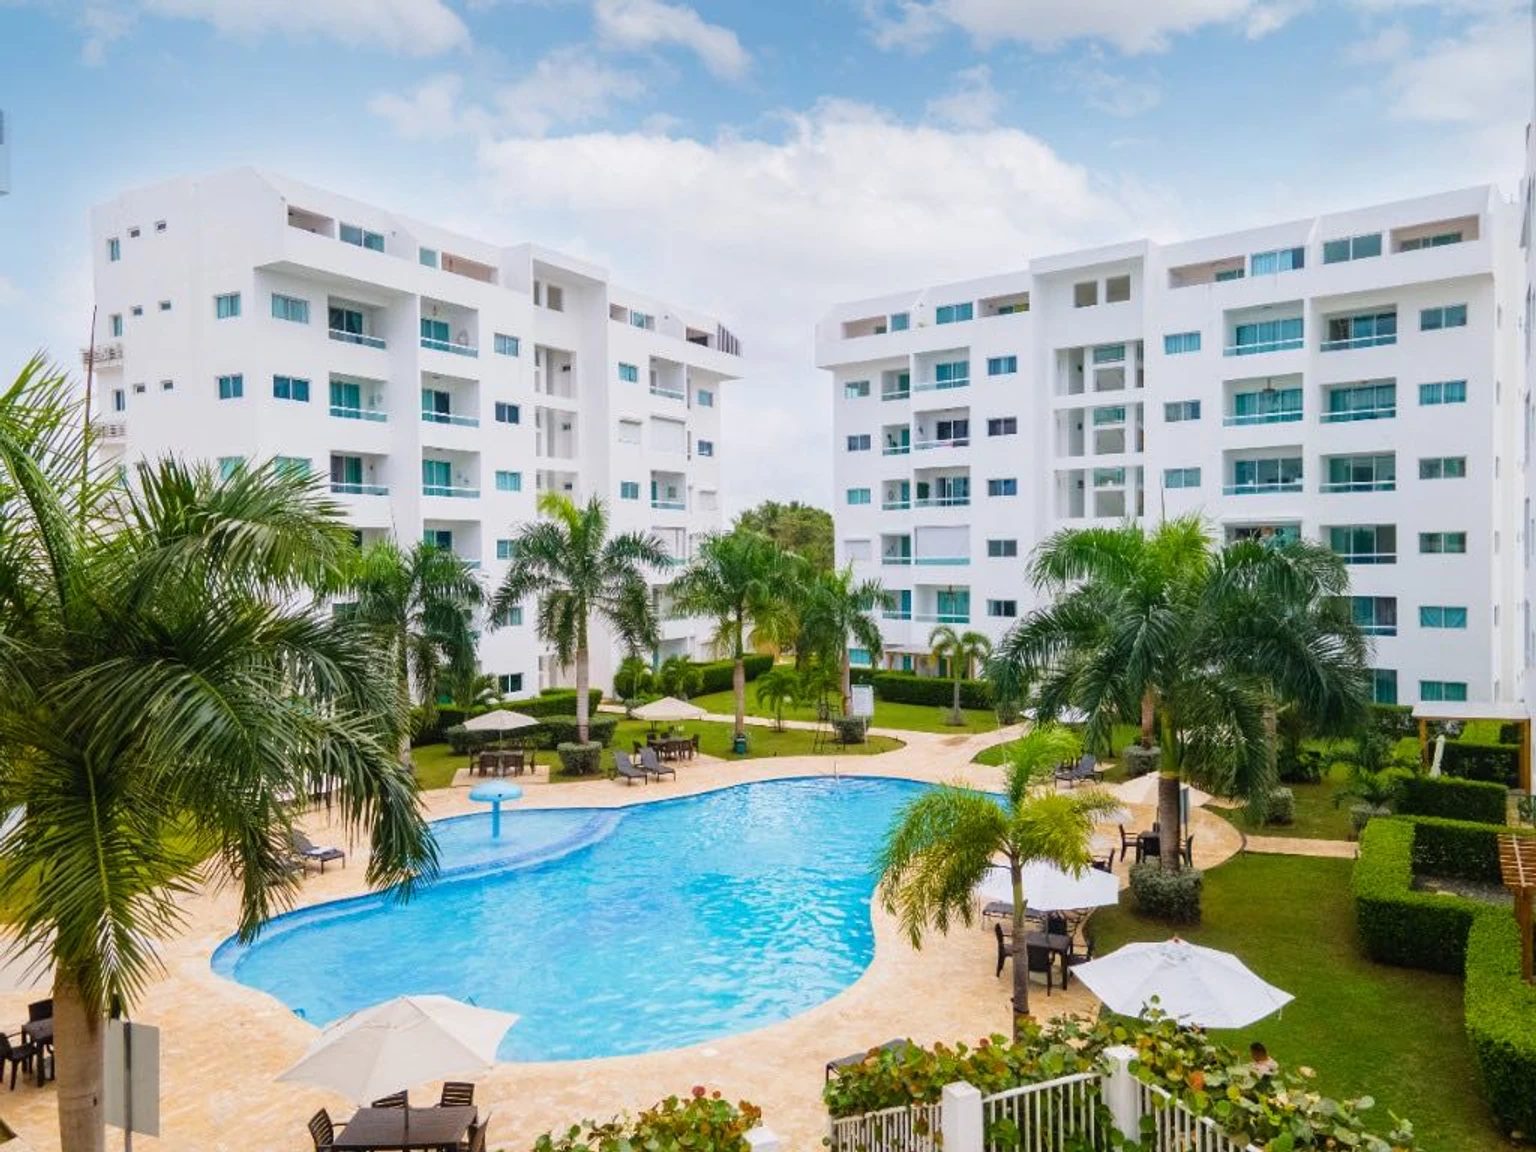
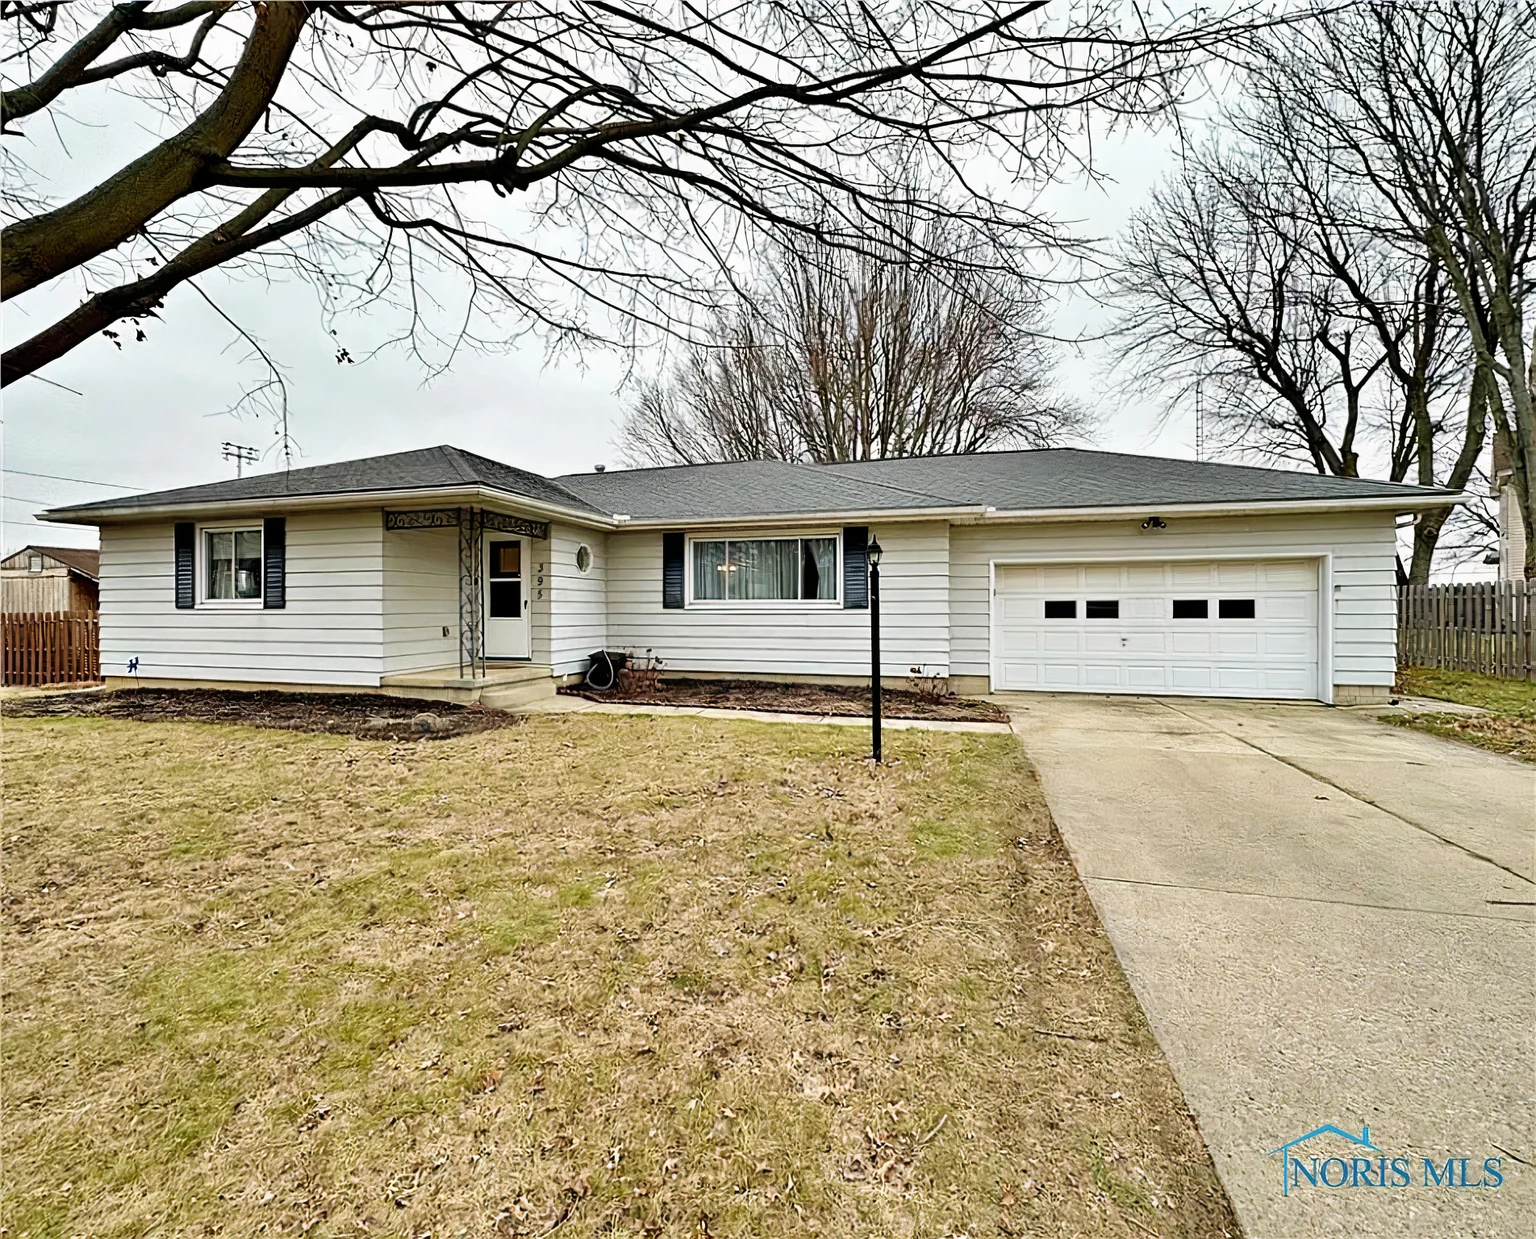
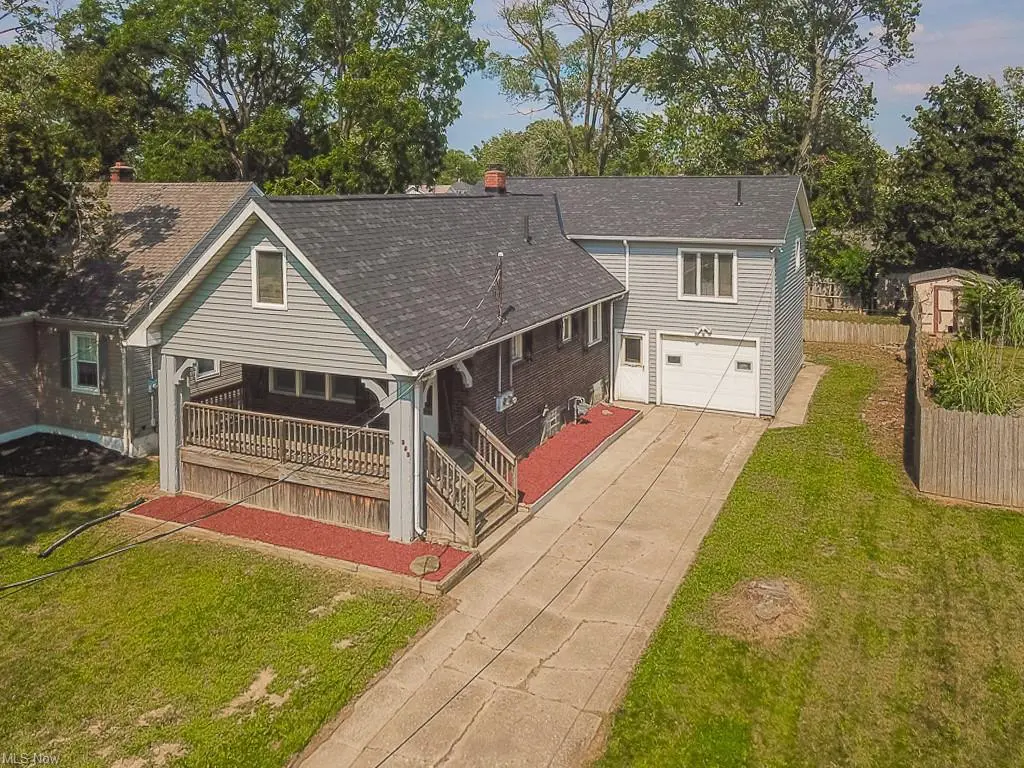
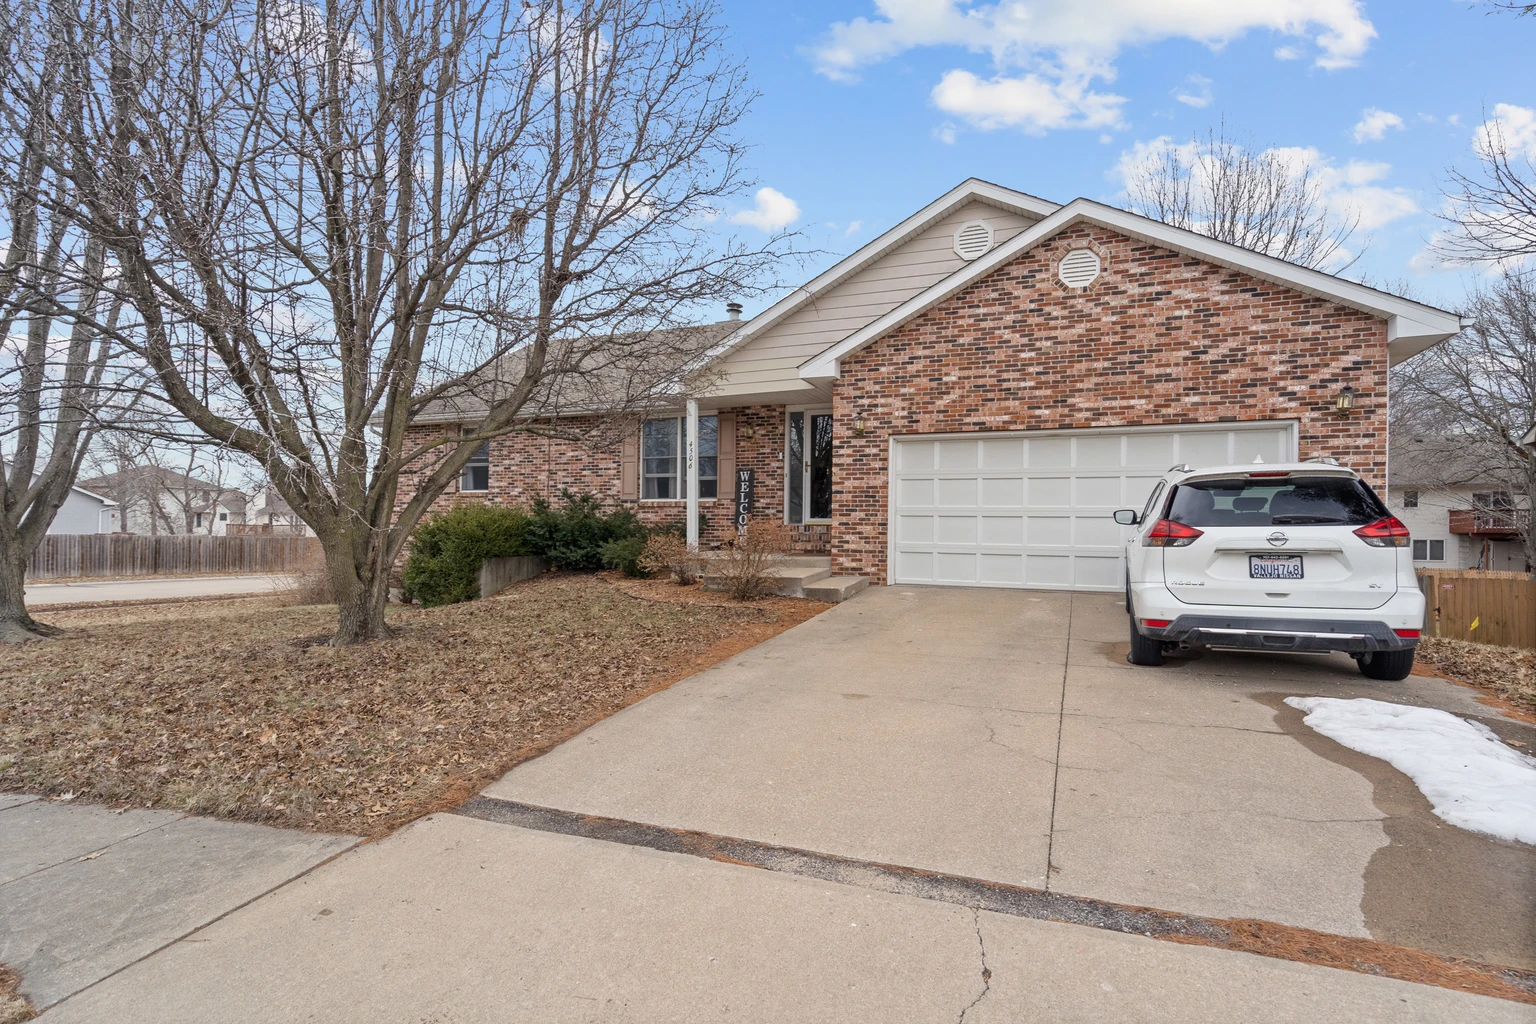
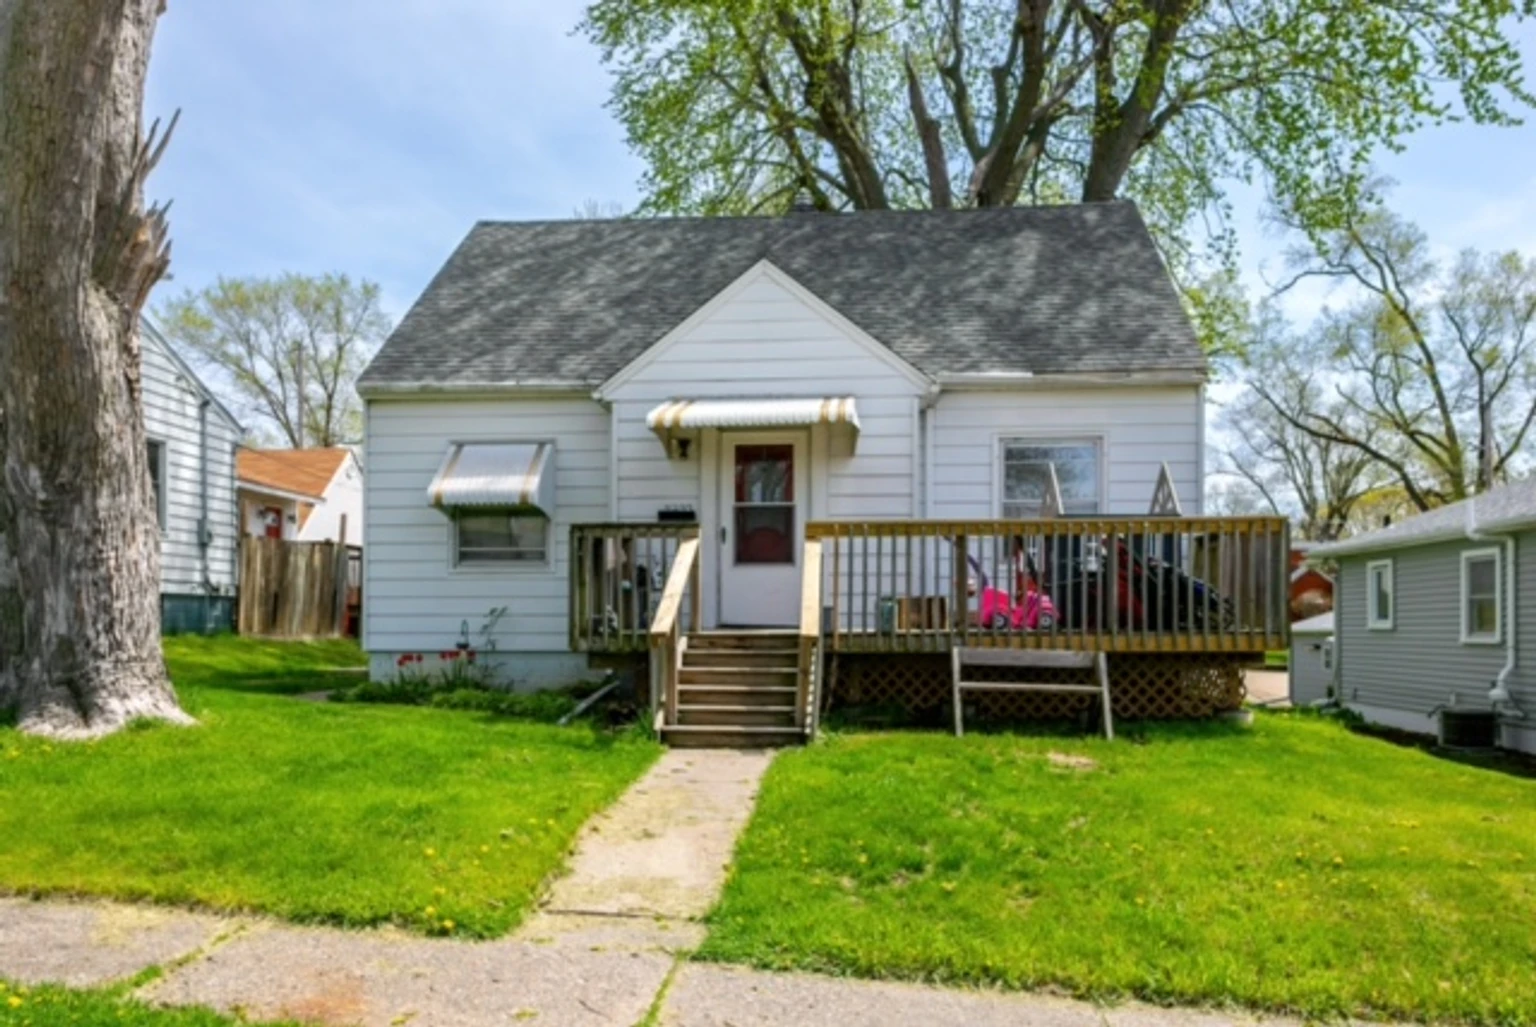
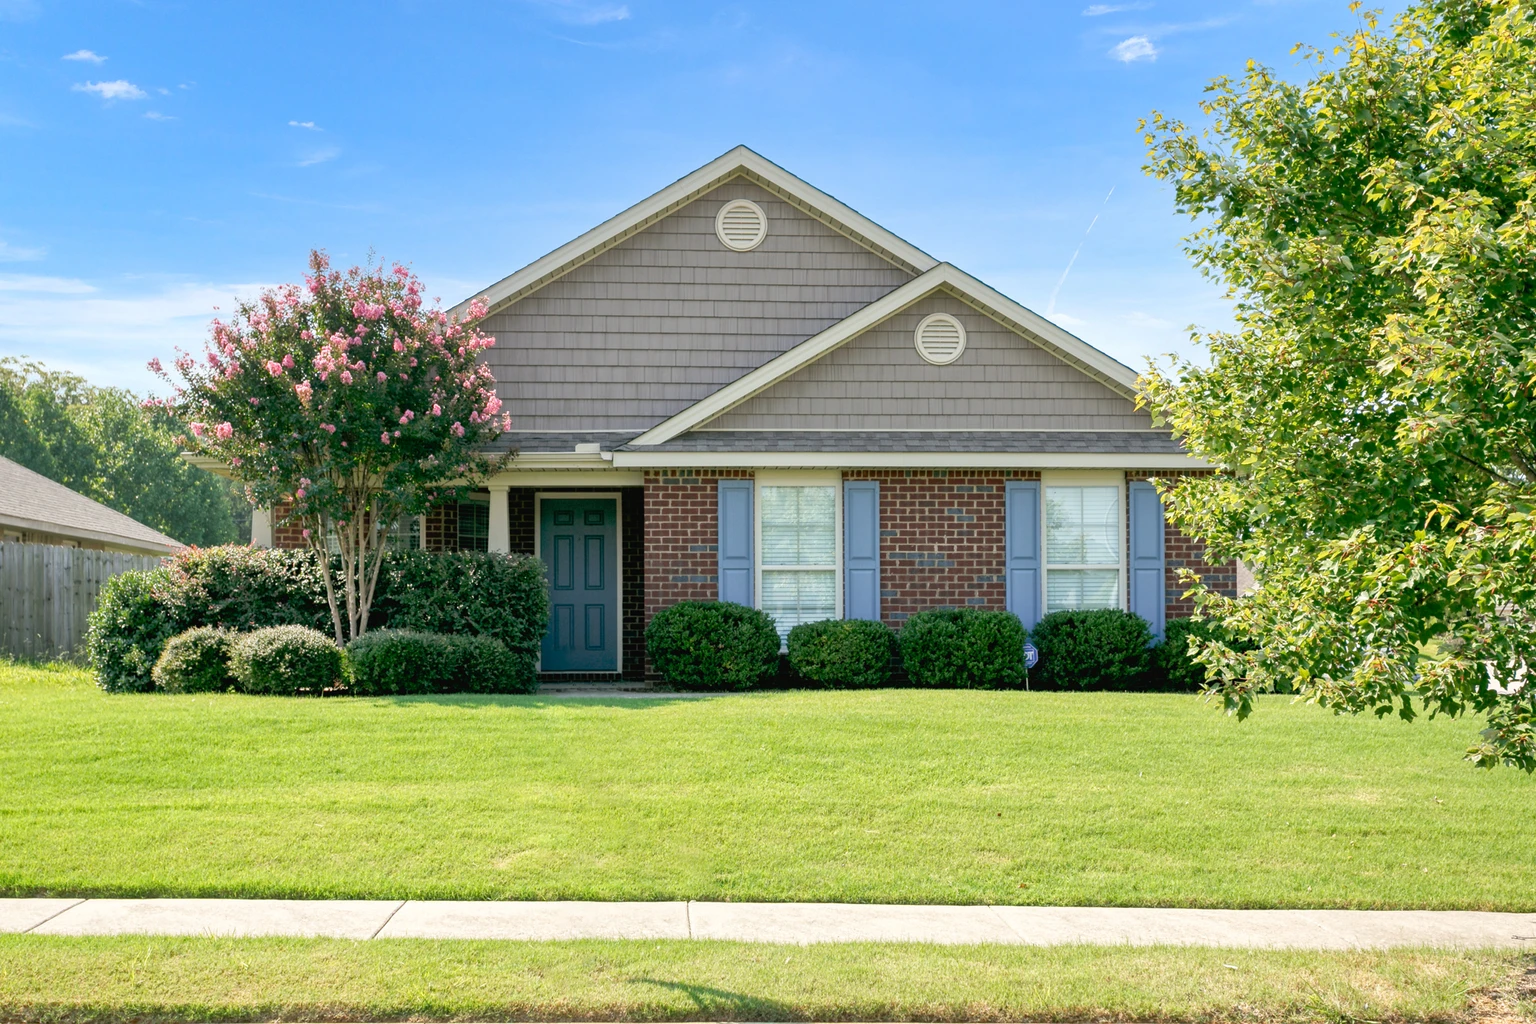
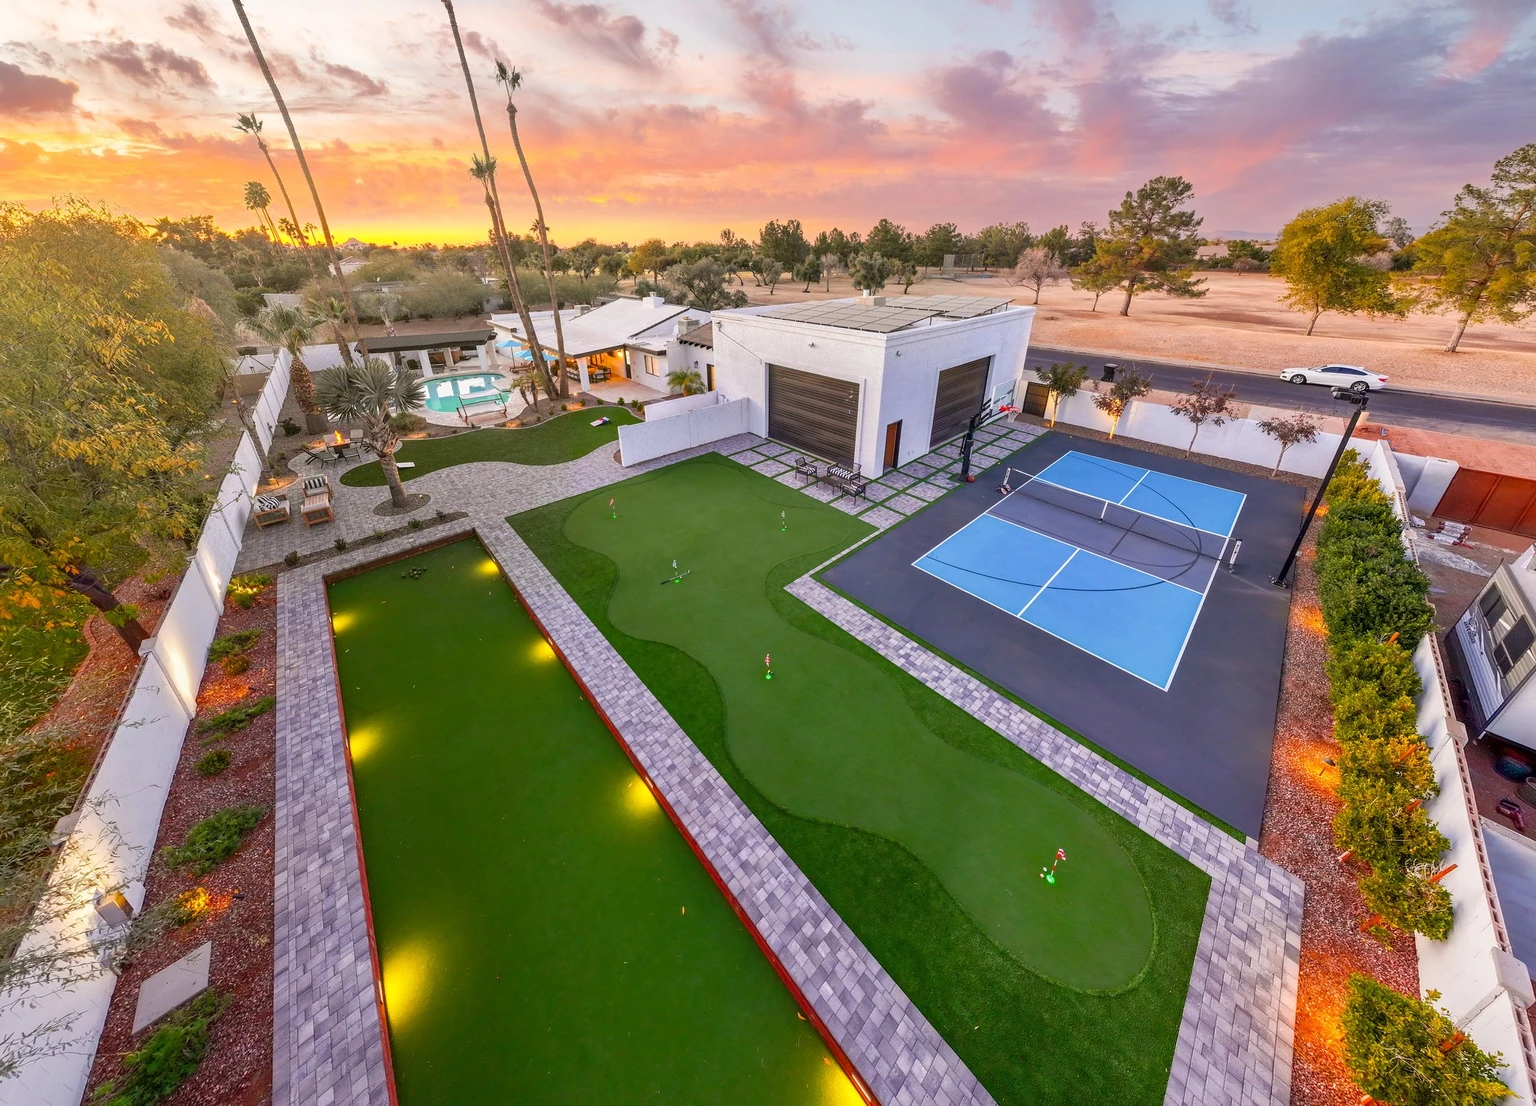
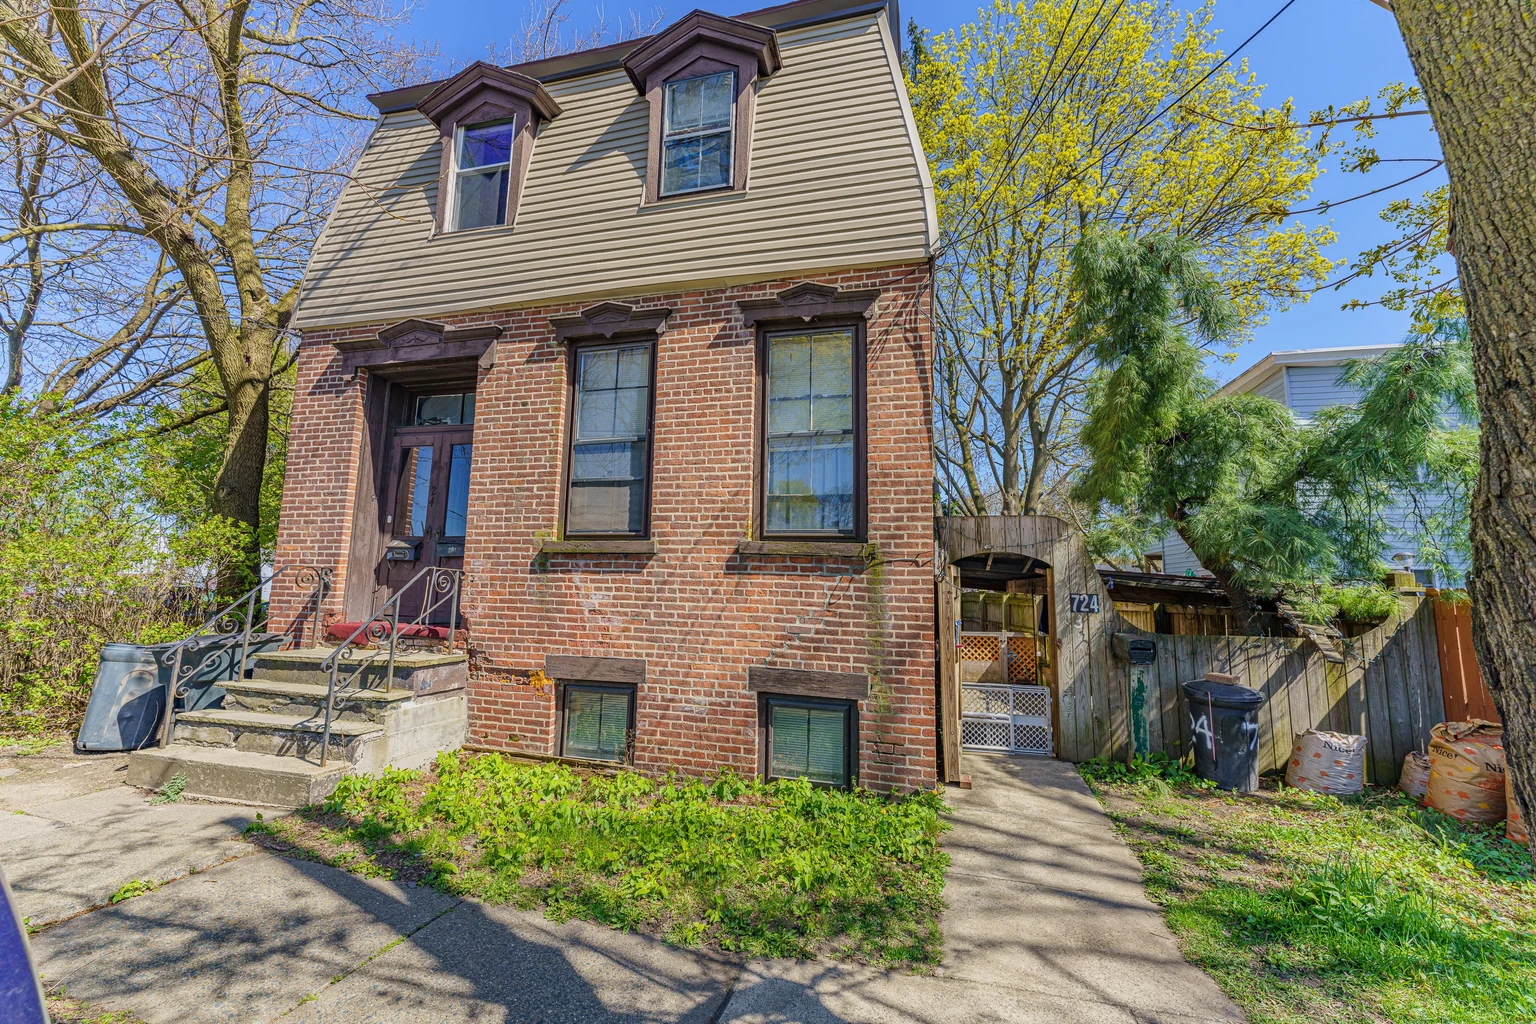
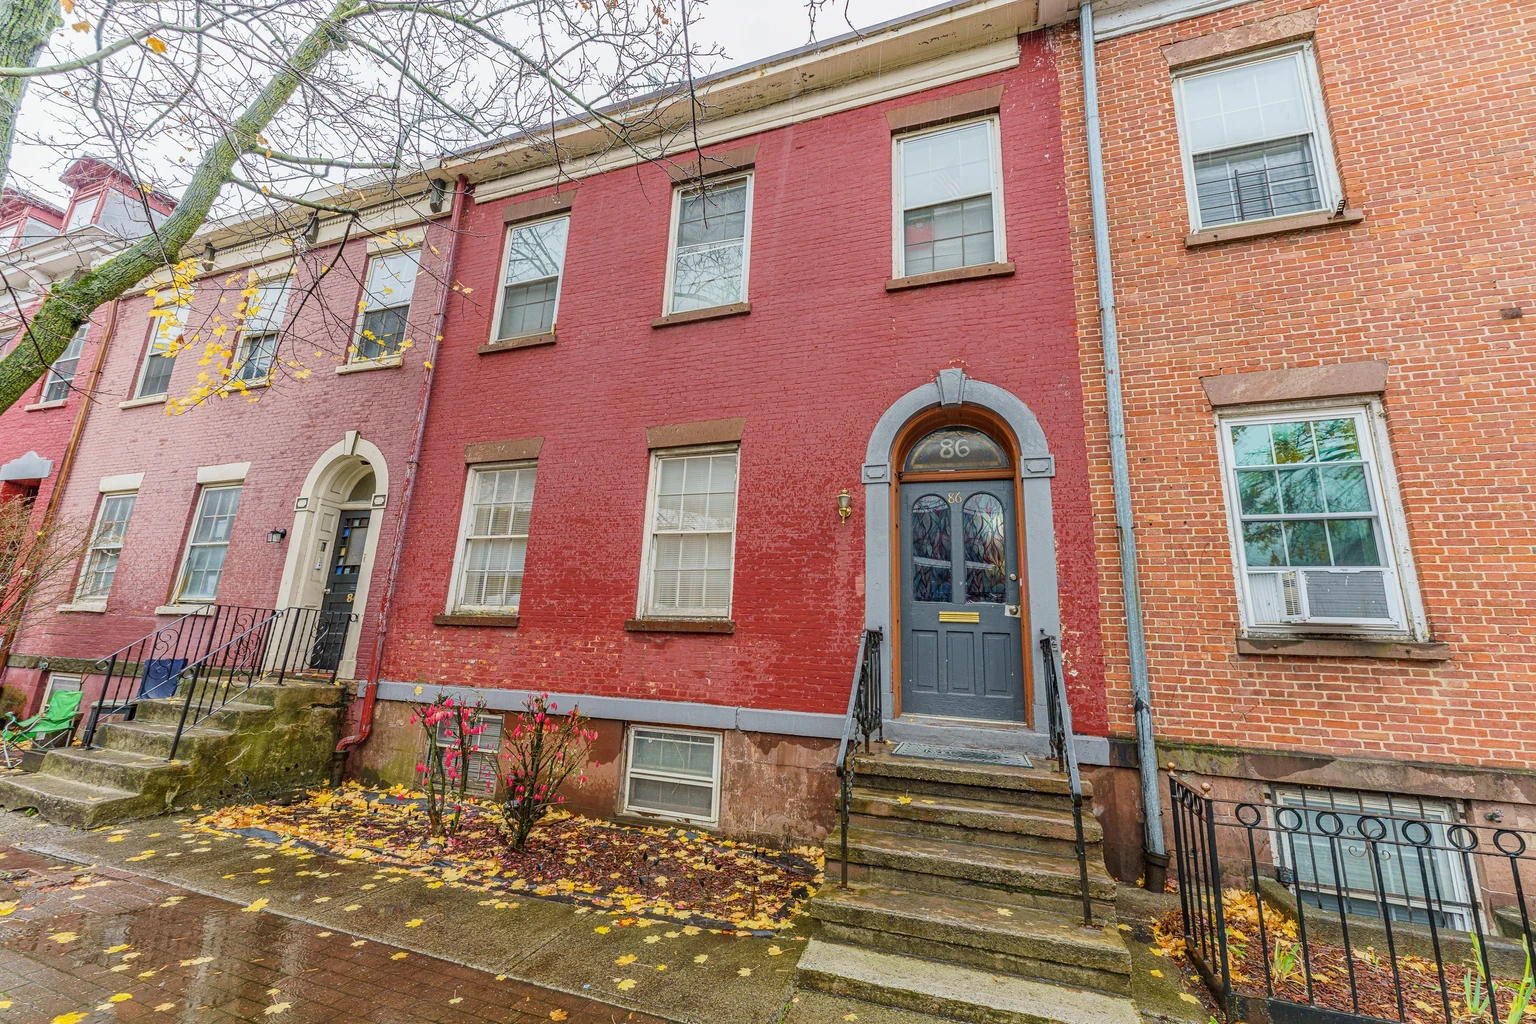
Recently Sold Investment Properties in Cleveland, OH
46 previously listed properties in Cleveland.















About the Cleveland Real Estate Investment Market
Cleveland is one of the most quietly outperforming real estate markets in the country heading into 2026. Median home values rose 3.6% YoY in February 2026 to roughly $232,000 at the metro level, ranking sixth among the top 40 U.S. markets and meaningfully ahead of the national 0.2% growth pace. At the city level, Redfin's March 2026 read pegs the median sale price at $135,000, up 3.3% YoY, with homes selling in 33 days, three days faster than a year earlier. PropertyIQ's 2026 framework gave Cleveland a market score of 88 out of 100, placing it among the nation's top cash-flow markets, and Zillow's forecast calls for another 3.4% appreciation over the next 12 months. The headline for Cleveland in 2026: durable, mid-single-digit appreciation in a market that still sits roughly 29% below its income-justified fundamental value.
Affordability is the structural advantage Cleveland keeps quietly compounding. The metro's median list price of about $241,000 sits well below the national median of roughly $379,000, and the city of Cleveland itself remains accessible for entry-level buyers and small landlords in a way that almost no coastal or Sun Belt metro can match. Active listings in February 2026 reached 4,650, up 9.8% YoY and the highest February level since 2022, but supply is still constrained relative to historical norms, and the pending-to-active ratio of 0.74 confirms demand is absorbing what comes online. Sale-to-list ratios sit at exactly 100% on average, meaning Cleveland sellers are getting their asking price on a typical transaction. Mortgage rates easing into the low-to-high 5% range over 2026 should pull more buyers in without pressuring inventory.
For investors, Cleveland is one of the few major U.S. markets where the cash-flow math still pencils on a single-family rental in 2026, but only if you underwrite the tax bill correctly. Cuyahoga County's 2.16% effective property tax rate consumes roughly 23% of gross rent on a typical SFR, which is the single biggest gotcha out-of-state investors miss. At median pricing, conventional financing produces negative cash flow on the average Cleveland house. Where investors actually make money is by buying 15%–25% below median, leaning on Section 8 fair-market rents (which exceed open-market rents by $300–$700 in the right zip codes), or focusing on renovate-able product in neighborhoods like Glenville, Slavic Village, and the Detroit-Shoreway corridor. Cap rates in Class B/C neighborhoods routinely come in at 8%–12%, with distressed and turnkey value-add deals printing 9%–13%.
The neighborhood story in Cleveland 2026 is bifurcated and worth understanding. The high end: Tremont, Ohio City, Downtown Cleveland: has matured into a walkable, restaurant-and-gallery urban core with median sales in the $210,000–$321,000 range and renter shares above 69%, drawing young professionals and capital from coastal markets. The yield play sits one tier below: North Collinwood (median around $89,000), Glenville (around $85,000 with a remarkable 22.4% gross rental yield on the right deals), and Detroit-Shoreway (around $216,000 with ~10.6% gross yields). Cleveland's healthcare anchors: Cleveland Clinic, University Hospitals, MetroHealth, plus Case Western Reserve and a growing tech and manufacturing base give the rental thesis a long runway.
Key Market Statistics for Cleveland
| Median Sale Price | Inventory Level | Avg Days on Market | YoY Price Change |
|---|---|---|---|
| $135,000 | 4,650 | 33 days | +3.3% |
Source: aggregated public real estate data, as of March 2026.
Year-Over-Year Market Comparison
Cleveland's 2025-into-2026 trajectory has been steadier than nearly any other major U.S. metro. Home prices grew 3.6% YoY at the metro level in February 2026, comfortably outpacing the national 0.2% benchmark. City-level Redfin data shows the median sale price up 3.3% YoY to $135,000 in March 2026, with days on market improving from 36 days to 33. Active listings rebuilt from a low base, up 9.8% YoY in February 2026, but inventory growth still trailed the national 14.2% pace, keeping supply tight. Sales volume slipped about 8.3% YoY in February 2026, marking three consecutive February declines, but the absorption story (pending-to-active at 0.74, sale-to-list at 100%) suggests the slowdown is supply-driven rather than demand-driven. Cleveland led the nation in home price growth among top-40 metros at 10.3% YoY in early 2025, and while the pace has cooled, the underlying combination of low entry prices, durable rental demand, and below-fundamental-value pricing keeps the trend going.
Trending Neighborhoods in Cleveland
- Tremont
- Ohio City
- Downtown Cleveland
- Detroit-Shoreway
- University Circle
- North Collinwood
- Glenville
- Slavic Village
- Old Brooklyn
- Lakewood
In-Demand Property Types in Cleveland
- Section 8-eligible single-family rentals
- Small multifamily (2–4 unit) on the near west and east sides
- Renovated colonials and bungalows in inner-ring suburbs
- Loft and condo conversions in Tremont / Ohio City
Recent Market Shifts & Trends
The most important shift in Cleveland's 2026 market is that institutional and out-of-state investor capital has finally noticed the cash-flow story, which is gradually compressing cap rates in the most desirable submarkets while leaving plenty of yield on the table elsewhere. New listings rose 9.4% YoY in early 2026, well above the national 2.4% pace, but the pending-to-active ratio of 0.74 shows demand is keeping pace. Cleveland leads the nation in undervaluation among top-tier markets (~29% below income-justified fundamental value), and Zillow's 3.4% twelve-month forecast plus PropertyIQ's 88/100 market score both point to continued mid-single-digit appreciation. The biggest risk vector is property tax, Cuyahoga County's 2.16% effective rate is materially above the national average and reassessment cycles can swing NOI meaningfully, but the affordability buffer is wide enough that even with that drag, Cleveland's 2026 setup is one of the most investor-friendly in the country.
Expert Insights
“Cleveland scored 88 out of 100 on our 2026 market index, placing it among the nation's top cash flow markets. Home values were essentially flat year-over-year at the city level (down 0.21%) while the metro median listing price held at $241,220, but the supply-demand picture is what stands out: pending-to-active ratio of 0.74, sale-to-list at 100%, and a market roughly 29% below income-justified fundamental value. Zillow's twelve-month appreciation forecast of 3.4% looks conservative if rates ease as expected.”
“Cleveland's February 2026 median price of $232,000 was up 3.6% year-over-year, ranking sixth among the top 40 U.S. markets and well ahead of the 0.2% national growth rate. Active listings hit their highest February level since 2022 at 4,650, up 9.8%, but inventory growth still trailed the national pace, leaving Cleveland structurally tight despite the rebuild. The combination of price growth, affordability, and supply discipline is what keeps Cleveland on national investor lists.”
“For SFR investors, Cleveland's practical math comes down to the property tax line. Cuyahoga County's 2.16% effective rate consumes roughly 23% of gross rent at median prices, and at median prices with conventional financing, expected cash flow is meaningfully negative. The investors making money in Cleveland are buying 15–25% below median, leveraging Section 8 fair-market rents, which exceed open-market rents by $300–$700 in the right zip codes, and focusing on Class B/C product in neighborhoods like Glenville, Slavic Village, and Detroit-Shoreway, where cap rates run 8–12% and the value-add ladder is well-defined.”
Key Takeaways
For investors, Cleveland in 2026 is one of the strongest pure cash-flow stories in the country, but only if the underwriting is honest about Cuyahoga County property taxes. Three actionable points: (1) Buy 15%–25% below the metro median to make the cash-flow math work; chasing turnkey listings at full price in the suburbs almost always pencils negative once taxes and capex are normalized. (2) Section 8 is a feature, not a bug, fair-market rents in target neighborhoods exceed open-market rents by hundreds of dollars per month, and operators who run that play professionally pull double-digit yields without distress-level inventory. (3) The two-tiered neighborhood map matters: Tremont, Ohio City, and Detroit-Shoreway give you appreciation plus rent growth, while Glenville, Slavic Village, and North Collinwood give you yield. Cleveland's combination of below-fundamental-value pricing, durable rental demand from healthcare and university anchors, and 3%–5% baseline appreciation makes the metro a defensible long-hold position in 2026.
Frequently Asked Questions About Cleveland Real Estate
Is Cleveland, OH a good market for fractional real estate investing?
For investors, Cleveland in 2026 is one of the strongest pure cash-flow stories in the country, but only if the underwriting is honest about Cuyahoga County property taxes. Three actionable points: (1) Buy 15%–25% below the metro median to make the cash-flow math work; chasing turnkey listings at full price in the suburbs almost always pencils negative once taxes and capex are normalized. (2) Section 8 is a feature, not a bug, fair-market rents in target neighborhoods exceed open-market rents by hundreds of dollars per month, and operators who run that play professionally pull double-digit yields without distress-level inventory. (3) The two-tiered neighborhood map matters: Tremont, Ohio City, and Detroit-Shoreway give you appreciation plus rent growth, while Glenville, Slavic Village, and North Collinwood give you yield. Cleveland's combination of below-fundamental-value pricing, durable rental demand from healthcare and university anchors, and 3%–5% baseline appreciation makes the metro a defensible long-hold position in 2026.
What is the median sale price in Cleveland, OH?
The median sale price in Cleveland, OH is approximately $135,000 as of March 2026.
What are trending neighborhoods in Cleveland, OH?
Trending neighborhoods in Cleveland, OH include Tremont, Ohio City, Downtown Cleveland, Detroit-Shoreway, University Circle, North Collinwood.
What property types are in demand for investment properties in Cleveland, OH?
In-demand investment property types in Cleveland, OH include Section 8-eligible single-family rentals, Small multifamily (2–4 unit) on the near west and east sides, Renovated colonials and bungalows in inner-ring suburbs, Loft and condo conversions in Tremont / Ohio City.
Data Sources
- PropertyIQ, Cleveland 2026 Market Analysis
- Homes.com, Cleveland Housing Market Report
- Redfin, Cleveland Housing Market
- Zillow: Cleveland, OH Home Values
- Norada Real Estate, Cleveland Forecast 2025-2026
- Howard Hanna, 2026 Cleveland Housing Market Outlook
- PropertyDNA, Cleveland Rental Market
- DoorVault, Cleveland Rental Market Report 2026
- Overland Properties, Cleveland Neighborhoods 2025
- FRED: Median Days on Market, Cuyahoga County
Other Investment Property Markets Near Cleveland
Explore fractional real estate investment properties in other U.S. markets on Lofty.
- Investment Properties in Akron, OH
- Investment Properties in Cincinnati, OH
- Investment Properties in Gibsonburg, OH
- Investment Properties in McCutchenville, OH
- Investment Properties in Tiffin, OH
- Investment Properties in Acton, CA
- Investment Properties in Albany, NY
- Investment Properties in Albuquerque, NM
- Investment Properties in Atlanta, GA
- Investment Properties in Atlantic City, NJ
- Investment Properties in Austin, TX
- Investment Properties in Avon Park, FL