'/%3e%3cpath%20d='M110.5%2074.84L61.56%20113.3V150.04H0V87.4L110.5%200V74.84Z'%20fill='url(%23paint1_linear_1102_1766)'/%3e%3cpath%20d='M159.44%20150.04L159.44%20205.81H159.2L110.5%20166.53L61.8001%20205.81H61.5601L61.56%20150.04L110.5%20110.57L159.44%20150.04Z'%20fill='url(%23paint2_linear_1102_1766)'/%3e%3cpath%20d='M110.5%20110.57V166.53L61.8001%20205.81H61.5601L61.56%20150.04L110.5%20110.57Z'%20fill='url(%23paint3_linear_1102_1766)'/%3e%3cpath%20d='M159.44%20206H61.5601L61.8001%20205.81L110.5%20166.53L159.2%20205.81L159.44%20206Z'%20fill='url(%23paint4_linear_1102_1766)'/%3e%3cdefs%3e%3clinearGradient%20id='paint0_linear_1102_1766'%20x1='166'%20y1='-19.908'%20x2='145.641'%20y2='227.731'%20gradientUnits='userSpaceOnUse'%3e%3cstop%20stop-color='%23B5AAFF'/%3e%3cstop%20offset='0.723958'%20stop-color='%238977FF'/%3e%3c/linearGradient%3e%3clinearGradient%20id='paint1_linear_1102_1766'%20x1='64'%20y1='15.7891'%20x2='172.309'%20y2='257.652'%20gradientUnits='userSpaceOnUse'%3e%3cstop%20stop-color='%239383FF'/%3e%3cstop%20offset='0.75'%20stop-color='%234D3FED'/%3e%3c/linearGradient%3e%3clinearGradient%20id='paint2_linear_1102_1766'%20x1='171.462'%20y1='36.6188'%20x2='8.598'%20y2='270.272'%20gradientUnits='userSpaceOnUse'%3e%3cstop%20offset='0.229167'%20stop-color='%23B5AAFF'/%3e%3cstop%20offset='0.994792'%20stop-color='%238977FF'/%3e%3c/linearGradient%3e%3clinearGradient%20id='paint3_linear_1102_1766'%20x1='55.7219'%20y1='-31.3876'%20x2='76.8187'%20y2='349.172'%20gradientUnits='userSpaceOnUse'%3e%3cstop%20offset='0.307292'%20stop-color='%239383FF'/%3e%3cstop%20offset='0.854167'%20stop-color='%234D3FED'/%3e%3c/linearGradient%3e%3clinearGradient%20id='paint4_linear_1102_1766'%20x1='110'%20y1='271'%20x2='76.5255'%20y2='202.314'%20gradientUnits='userSpaceOnUse'%3e%3cstop%20stop-color='%23B5AAFF'/%3e%3cstop%20offset='0.90625'%20stop-color='%238977FF'/%3e%3c/linearGradient%3e%3c/defs%3e%3c/svg%3e)
'/%3e%3cpath%20d='M110.5%2074.84L61.56%20113.3V150.04H0V87.4L110.5%200V74.84Z'%20fill='url(%23paint1_linear_1102_1752)'/%3e%3cpath%20d='M159.44%20150.04L159.44%20205.81H159.2L110.5%20166.53L61.8001%20205.81H61.5601L61.56%20150.04L110.5%20110.57L159.44%20150.04Z'%20fill='url(%23paint2_linear_1102_1752)'/%3e%3cpath%20d='M110.5%20110.57V166.53L61.8001%20205.81H61.5601L61.56%20150.04L110.5%20110.57Z'%20fill='url(%23paint3_linear_1102_1752)'/%3e%3cpath%20d='M159.44%20206H61.5601L61.8001%20205.81L110.5%20166.53L159.2%20205.81L159.44%20206Z'%20fill='url(%23paint4_linear_1102_1752)'/%3e%3cdefs%3e%3clinearGradient%20id='paint0_linear_1102_1752'%20x1='166'%20y1='-19.908'%20x2='145.641'%20y2='227.731'%20gradientUnits='userSpaceOnUse'%3e%3cstop%20stop-color='%23B5AAFF'/%3e%3cstop%20offset='0.723958'%20stop-color='%238977FF'/%3e%3c/linearGradient%3e%3clinearGradient%20id='paint1_linear_1102_1752'%20x1='64'%20y1='15.7891'%20x2='172.309'%20y2='257.652'%20gradientUnits='userSpaceOnUse'%3e%3cstop%20stop-color='%239383FF'/%3e%3cstop%20offset='0.75'%20stop-color='%234D3FED'/%3e%3c/linearGradient%3e%3clinearGradient%20id='paint2_linear_1102_1752'%20x1='171.462'%20y1='36.6188'%20x2='8.598'%20y2='270.272'%20gradientUnits='userSpaceOnUse'%3e%3cstop%20offset='0.229167'%20stop-color='%23B5AAFF'/%3e%3cstop%20offset='0.994792'%20stop-color='%238977FF'/%3e%3c/linearGradient%3e%3clinearGradient%20id='paint3_linear_1102_1752'%20x1='55.7219'%20y1='-31.3876'%20x2='76.8187'%20y2='349.172'%20gradientUnits='userSpaceOnUse'%3e%3cstop%20offset='0.307292'%20stop-color='%239383FF'/%3e%3cstop%20offset='0.854167'%20stop-color='%234D3FED'/%3e%3c/linearGradient%3e%3clinearGradient%20id='paint4_linear_1102_1752'%20x1='110'%20y1='271'%20x2='76.5255'%20y2='202.314'%20gradientUnits='userSpaceOnUse'%3e%3cstop%20stop-color='%23B5AAFF'/%3e%3cstop%20offset='0.90625'%20stop-color='%238977FF'/%3e%3c/linearGradient%3e%3c/defs%3e%3c/svg%3e)


11604 D K Ranch Rd
11604 D K Ranch Rd
Austin, TX 78759
 Airbnb listing
About
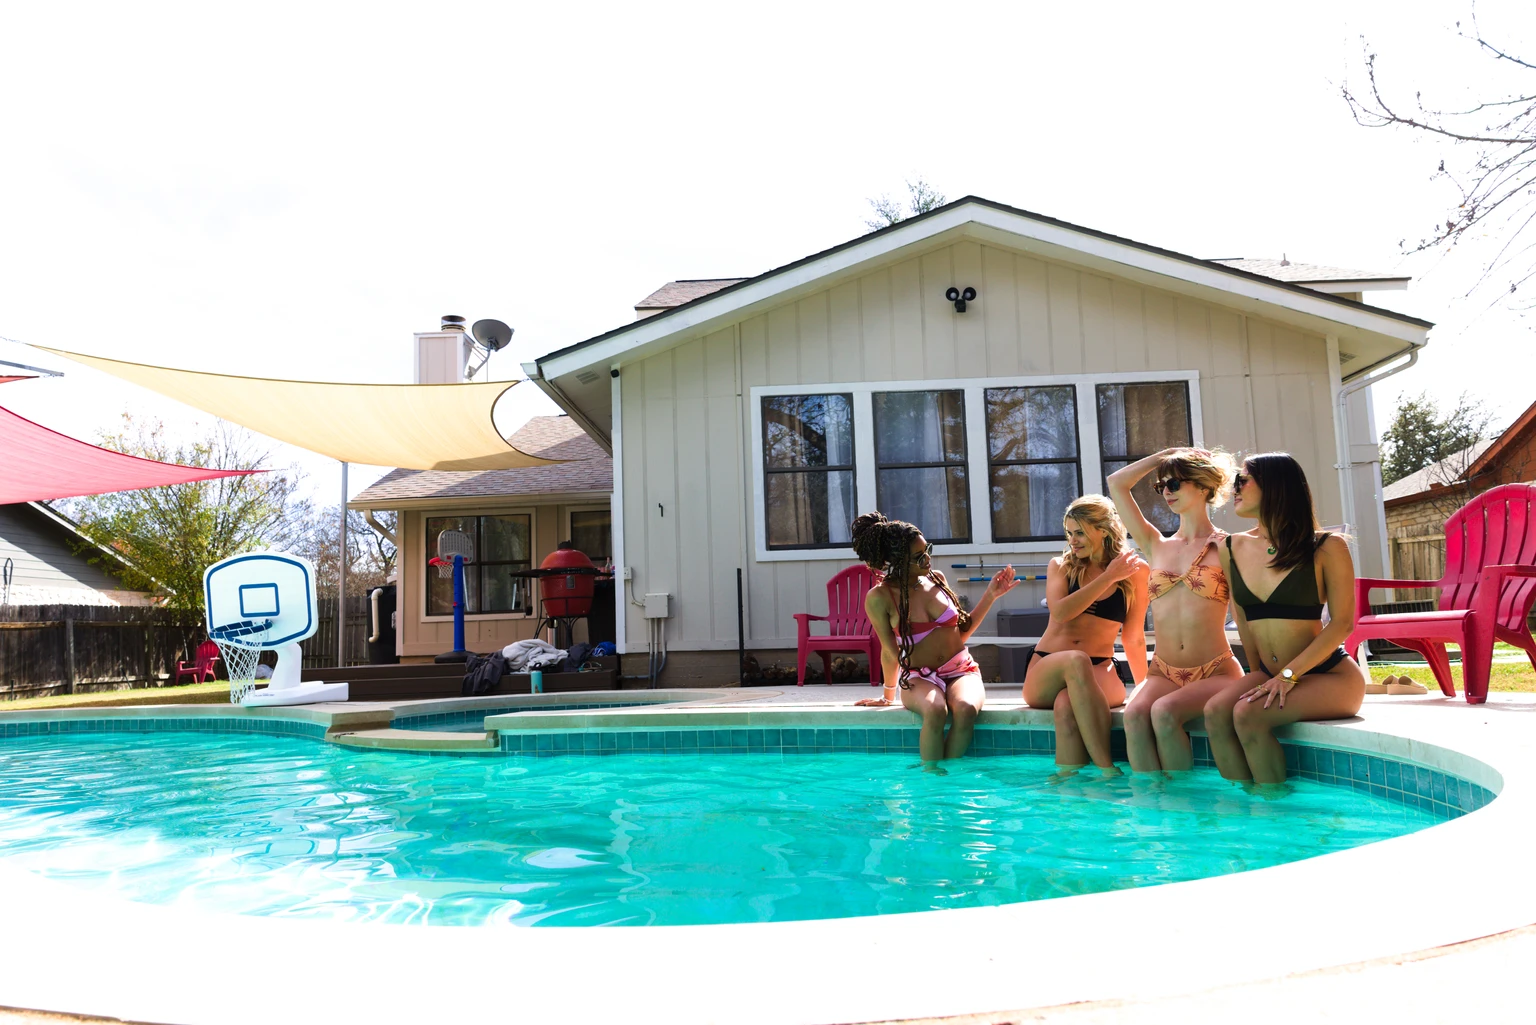
Guest-favorite short-term rental in Austin with a game room featuring a pool table, arcade machines, ping pong, and a ball pit. The property is listed at $882,900, representing a 7.7% ($74,100) discount from the $957,000 appraised value, and was fully renovated by the co-owner’s construction company. The home includes a fully equipped kitchen, large dining area, smart TVs, work-from-home space, and newly renovated bathrooms with a washer and dryer. Outdoor features include a private backyard with a pool, hot tub, Kamado Joe BBQ, and LED lighting. Additional elements include a downstairs sleeping area with bunk beds and a queen room, along with security cameras, noise detectors, and enforced quiet hours from 10pm to 7am.
Property Management
Gary Tsang
Gary is a Superhost on Airbnb with 3+ years hosting experience with property management experience in Austin and in the Bay Area. Gary has over 280 reviews, and an overall rating of 4.88/5 stars. Gary is an ex-ebay, ex-Chegg marketing executive that uses his marketing knowledge, real estate background and passion for traveling to find, furnish, and manage his properties.
Due Diligence Documents
About this offering
The Market
Austin, TX
Austin pairs a fast-growing tech economy with a lifestyle that keeps drawing new residents. Apple, Tesla, Oracle, and a deep startup scene sit alongside the University of Texas and state government, giving the city a broad job base. Lady Bird Lake, Barton Springs, and a famous live-music scene make it a great place to live, and Texas has no state income tax. Continued population growth has kept long-term housing demand strong.
Property Updates
Owners are now receiving daily rent calculated from July's cash flow, continuing through September 12th.
For July, the net cash flow totaled $3,068.92, compared to June's figure of $2,589.14.
Investor Reviews
Frequently Asked Questions
Have questions?
Have other questions? Learn how Lofty works
Share price
11604 D K Ranch Rd
Austin, TX 78759
About
Guest-favorite short-term rental in Austin with a game room featuring a pool table, arcade machines, ping pong, and a ball pit. The property is listed at $882,900, representing a 7.7% ($74,100) discount from the $957,000 appraised value, and was fully renovated by the co-owner’s construction company. The home includes a fully equipped kitchen, large dining area, smart TVs, work-from-home space, and newly renovated bathrooms with a washer and dryer. Outdoor features include a private backyard with a pool, hot tub, Kamado Joe BBQ, and LED lighting. Additional elements include a downstairs sleeping area with bunk beds and a queen room, along with security cameras, noise detectors, and enforced quiet hours from 10pm to 7am.
Property Management
Gary Tsang
Gary is a Superhost on Airbnb with 3+ years hosting experience with property management experience in Austin and in the Bay Area. Gary has over 280 reviews, and an overall rating of 4.88/5 stars. Gary is an ex-ebay, ex-Chegg marketing executive that uses his marketing knowledge, real estate background and passion for traveling to find, furnish, and manage his properties.
Due Diligence Documents
Offering Details
The Market
Austin, TX
Austin pairs a fast-growing tech economy with a lifestyle that keeps drawing new residents. Apple, Tesla, Oracle, and a deep startup scene sit alongside the University of Texas and state government, giving the city a broad job base. Lady Bird Lake, Barton Springs, and a famous live-music scene make it a great place to live, and Texas has no state income tax. Continued population growth has kept long-term housing demand strong.
Property Updates
Owners are now receiving daily rent calculated from July's cash flow, continuing through September 12th.
For July, the net cash flow totaled $3,068.92, compared to June's figure of $2,589.14.
Investor Reviews
Frequently Asked Questions
Need Help?
Have other questions? Learn how Lofty works
Projected Returns
Investing with Lofty can generate returns in two ways:
1) Annual cash flow from rental income.
2) Annual appreciation from long-term property value changes.
Monthly Cash Flow
$6,758.62
Monthly Rent
$5,546.90
Monthly Expenses
$1,211.72
Net Monthly Cash Flow
Annual Appreciation
Based on the Zillow Value Home Index (ZHVI) Single Family Homes Time Series, single family homes appreciated an average of 11% per year over the last 20 years (March 31, 2003 - March 31, 2023).
This figure reflects a national benchmark for single family homes in the 35th to 65th home-price percentile range and may not represent this specific property's zip code. Real-world returns can also vary based on investment costs, hold period, and leverage.
Use the returns calculator below to explore how different assumptions can impact your hypothetical investment outcome.
Projected Returns Calculator
Adjust the assumptions below to model how this property could grow over 7 years.
Annualized Return
+3.6%
per year over 7 years
7-Year Projection
$1,286
+$286 vs. initial $1,000
This calculator is for illustrative purposes only and displays a range of hypothetical investment outcomes based on the inputs you provide. Actual investment outcomes depend on many factors and cannot be determined before the investment period ends. Historical performance is not indicative of future results.
The calculations assume a 7-year hold period and an average annual net operating income increase of 3%. The 10- and 20-year averages are based on data from the ZHVI Single Family Homes Time Series and reflect averages for single-family homes in the 35th to 65th percentile by home price.